
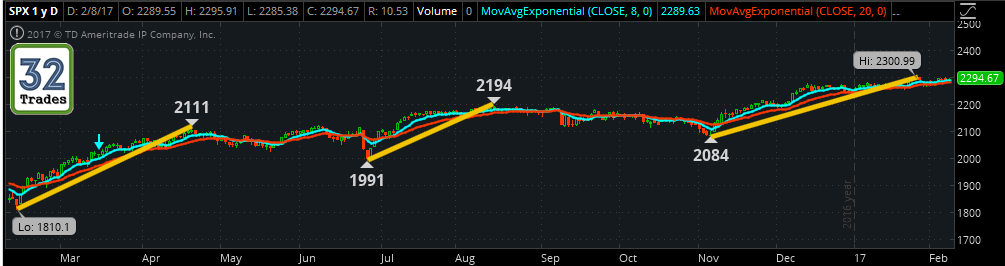
We’re two days from the bottom of the market, last year February 11, and we’re now 3 month into the post-election run up which has been the 3rd of 5 Elliot Waves. The 3rd is always the longest and strongest and as I pointed out and will detail a bit more here, is coming to a decision point by the end of this week.
Wave 1 lasted 2+ Months (Feb 11 – Apr 20). We then pulled back to double top the April 20 high level just before the BREXIT which began Wave 2: a just less than 2 month run (Jun 27 – Aug 23). From that, we pulled back to the highs of Wave 1 (SPX 2114) and began this current Wave 3 from the pre-Election lows, BUT, we’ve been on that trend line from the SPX 2114 and it’s about to pinch us into a BREAKOUT or BREAKDOWN point within the coming week:
SPX Wide View

SPX Closer View

Anytime you view charts, the trend lines need to be as accurate as humanly possible to get an exact look when you zoom in. When using a longer time frame chart, lines will tell a “summary” of what it looks like is going on, but when you zoom in on the closest chart possible, the 1 Day / 1 Min, you can see immediately how tight we are in this pinching corner of the triangle/wedge.
When we bounced at EXACTLY 9:50AM yesterday after breaking below the SPX 2286 1st Support by 0.62, this move back up into the pinching wedge formation, ALONG WITH all of the new 52 Wk & All Time Highs put in on a number of tickers we track, leads the horse to the watering hole which suggests: WHO KNOWS STILL UNTIL SPX 2301 – 2305 has been reached
| Close | High | |
| AAPL | 132.04 | 134.54 (All-Time) |
| AMZN | 819.71 | 845.00 (10-Day) |
| AMD | 13.56 | 14.27 (9-Year) |
| FB | 134.2 | 135.49 (All-Time) |
| GOOGL | 829.88 | 834.25 (5-Day) |
| TSLA | 262.08 | 269.34 (52Wk) |
| NFLX | 144.74 | 145.07 (All-Time) |
| NVDA | 118.61 | 120.92 (All-Time) |
| BABA | 103.57 | 104.84 (1-Month) |
| IWM | 135 | 137.96 (1-Month) |
| SPY | 229.24 | 229.71 (All-Time) |
| GLD | 118.19 | 118.59 (1-Month) |
| AGN | 241.17 | 255.88 (6-Month) |
| Dow Jones | 20054.34 | 20155.35 (All-Time) |
| S&P 500 | 2294.67 | 2300.99 (All-Time) |
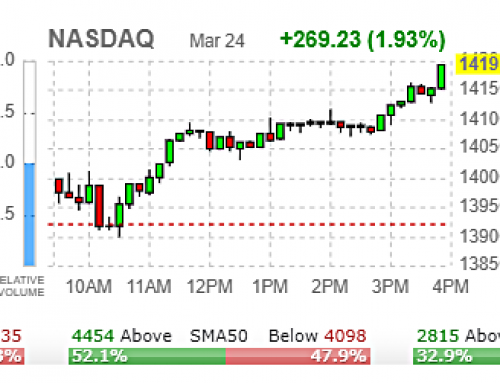
| Nasdaq | 5196.57 | 5201.57 (All-Time) |
| Russell 2000 | 1358.74 | 1392.71 (All-Time) |
The lack of any negative catalyst (even with that massive surplus in oil inventories yesterday), the overheated RSI(14)s above 70 and even 80, the change in the algorithm this past week from fibonacci pecrision sniper moves to surpassing even the 161.8 extensions on many proves that there is no simplified way at the moment to pick the spots like what worked up into last week. Scalp or stalk but going to take a piss while in a trade will blow up your account.
SPY Trade Ideas:
I went ahead yesterday and took some FEB 17 SPY 232 CALLS @ 0.17 since it looks quite probable we’re going to pinch upward into SPY 230 within the next few sessions.
TWTR


TWTR reports earnings before the opening bell today. We all know TWTR is a total money pit and is due to report losses again, but the comments and reaction from them will be the +/- catalyst to trade off. The massive HEAD on the daily chart above came from the period when every news source that spoke english was reporting a new “courter” who might be acquiring TWTR.
TWTR will be one to be focused on with some updates prior to the opening bell as to what we might be able to swing with it.
BAC

BAC hit my lower target range yesterday and I took some FEB 1 23.5 CALLS @ 0.06 (alerted in the chat). If this pinching wedge is to take us higher and all of the “global recession” mentions from different 1st world country currency market makers can hold off until the HARD BREXIT and/or the Italian Bank demise (oh yeah, there is still Greece), 23.40 would be the upper range area for BAC.
FB

AMZN

BABA

GOOGL

NFLX

CMG

TSLA

AMD


