
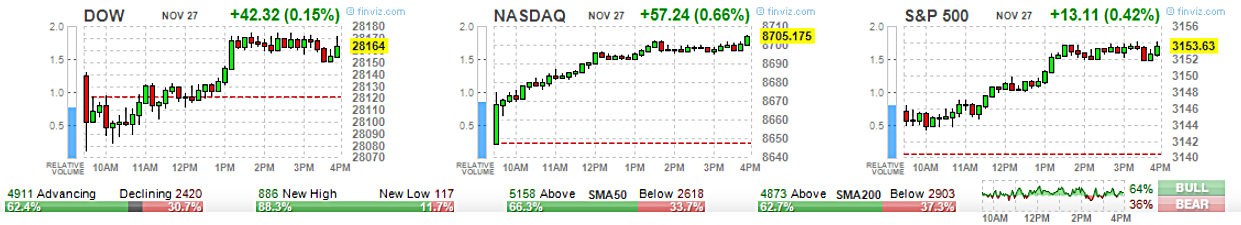
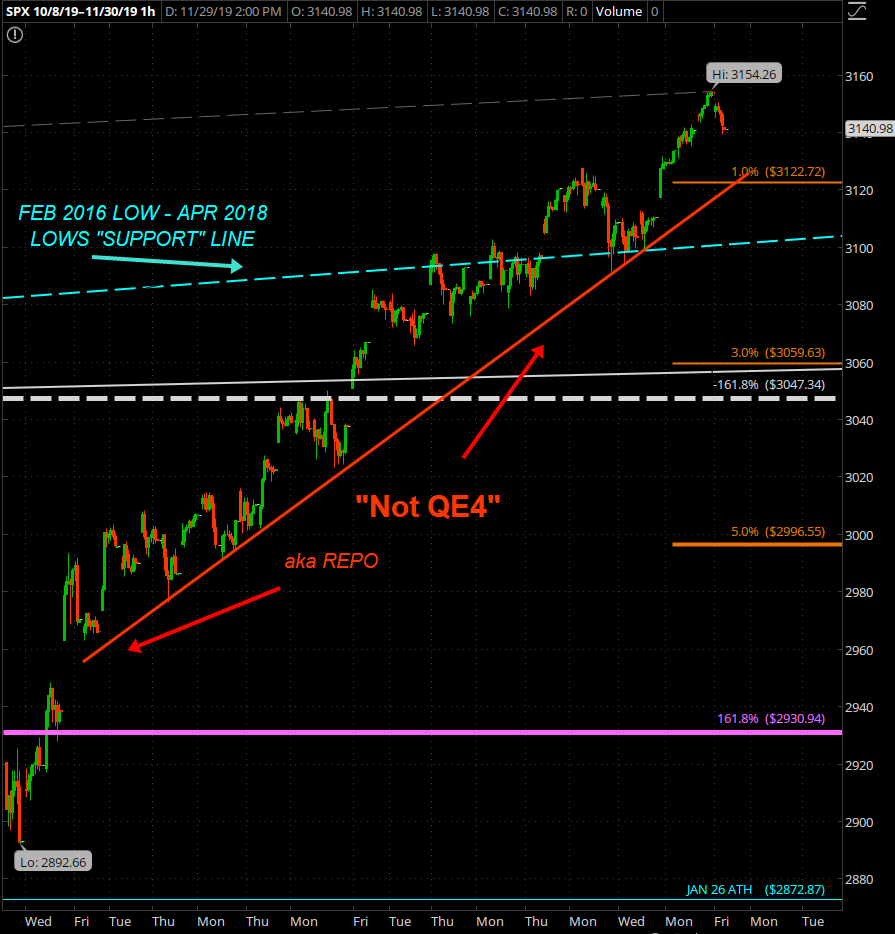
November will go down as one of the no dip months thanks to “NOT QE4” and “China REALLY wants to make a deal” as we closed off lowered guidance Q3 earnings beat/in-line reports and produced new ATHs on familiar names like AAPL, MSFT (the two which combined are higher market cap than the entire German DAX and also the Russell 2000), JPM, TGT, LULU, GOOGL, WMT and some new 2yr/10yr Highs on names like JD, BAC and even AMD.
November began @ 3050.72 (also the low of the month) after gapping over my 3047.34 and the JAN ’18 – SEP ’18 – JUL ’19 Highs line (gee, wonder if that was an important resistance) and ended the month @ 3140.98: -0.42% from the ATH (3154.26) placed into the close prior to Thanksgiving and the Hong Kong Bill signing (like an insider sell 8-K filing).
All in all: +103.54 for the month (High/Low) with a “no dip” dip of -1.16% from the ATH the week after OPEX (that 3091 NOV 20) with each upside pivot since mid OCT accomplished each week for the TOP of that week while filling each of the 2 overnight gaps above during the month and using a stair case of consistent support – typically right on the 5day moving average – for each “no dip” along the way by NOT OVERLAPPING ANY PREVIOUS WEEK’S LOW:
- 9 of the last sessions have closed above 3100
- SPX is +34.42% from the DEC LOW (25.82% from the 2018 Close)
- VWAP for 2019 is 2889.40 (currently and calculated off the close)
- Weekly RSI(14) is 69.34
- Weekly RSI(5) is 66.01 (with a SELL DIVERGENCE since mid NOV)
- 125 trading sessions since the last < 2800 prints
Actually, the Weekly RSI(5) has been embedded OVERBOUGHT (above 70) since “Not QE4” began which a) created those unfilled gaps back from 2893 and b) only dipped when we had our little -1.16% drop over 2 sessions (NOV 19 & 20) which, as you may recall from chat, OVERSOLD US on smaller time frames for the bounce and nearly cut the Weekly & Daily in half (low 50s on RSI reading) due to the lack of energy this +261.60p move off the OCT 8 LOW (2893) right around when the FED began supporting the market:
SO What Is “2 + 2 = 🐟” All About?
In the movie “The BIG Short”, the best line (for me) is that there above when Brownfield Fund is getting pressured due to the length of time the fraud ran back in 2005-2007 of the junk mortgage bond collapse which initiated the bank bailout and what we know today as QE. It was into that 2007 top me and my 3 partners closed our hedge fund while living/working from Spain, but it wasn’t SOLELY because of the blatant fraud, but because the market has a memory (which is why my pivots work so well for all you swinging)
SPX 1996 – 2009

For those who never had the chance to be excited when Windows 95 was released, you can’t KNOW what this is all about, but instead view it as what it is: A MEMORIZED CHART.
Besides the Y2K BUG scare, the markets were DOTcom proud in a booming consumer economy which had just come out of +15% mortgage rates to 7-8% and a Pablo Escobarian thrush of lavishness where 28.8k AOL.com connecting and 5 1/4 inch floppys disappeared and $30/week spent @ Blockbuster Video was “typical”
It was MARCH 2000 when BONDS peaked and a surge out of them into the end of Q1 2000 started the drop (along with the unknown of whom would become the President in the NOV 2000 elections). It wasn’t until the pre-election failure to take out the DOTcom high in SEP 2000 when the drop truly began which, as you can calculate, declined -50.5% over a 30 month period (which included 9/11)
It was the 1st time since 1974 that the SPX Monthly RSI(5) dropped below 15 and after a RUNNING SELL DIVERGENCE on it since 1996 (see that 680 on the chart above)
The OVERSOLD BOUNCE produced the “muscle memory” by which SPX rebounded over that exactly 5 year span to re-tag the DOTcom high, drop off it and get the 1st of 8 interest rate cuts to try and stop people from looking for FRAUD in the bond market which produced that DOUBLE TOP and then the DOUBLE BOTTOM / CLOSURE from where it all began @ 680
SPX FRAUD TOP

So you see where it started from, where it peaked, where it bottomed to, where it bounced to, where it bottomed back to and you are here, now +2487.47 points above that MAR 2009 SPX 666.79 bottom and guess what:
- It’s 2 + 2 = 🐟 time AGAIN
What’s the ATH? 3154.26? What’s -50% of that? 1577.43? Where have you seen that?
Sounds a bit “obtuse” to think this, but perhaps you heard the expression:
- Fool me once, shame on you
- Fool me twice, shame on me
- Fool me three times and I’m f*@king stupid
Baby boomers got the DOTcom dropped on them and then the 2007 mortgage fraud. Think they are getting caught a 3rd time when 2 + 2 = 🐟? That’s if you assume their collective holdings is part of that less than 10% of all equities owned which are held by Americans.
This is MY focus (a -50% drop) and all I needed was to see SPX 3047.34 accomplished for it to be, but it comes with some quite clear disclaimers: ARE WE IN/COMPLETING MAJOR 3 of Primary V?
SPX Wave View

Major Wave 1 of Primary V is +607.55p (2346.58 to 2954.13) from DEC ’18 to MAY ’19. What that then means in Elliot Wave terms is Major Wave 3 (which we’re assumed to be in having broken 3121) MUST BE LONGER THAN +607.55p since the 3rd wave CAN NOT be smaller than 1 or 5 (we haven’t gotten to 5 since we’re assuming we’re still in 3). Thus for this to be, Major 3 MUST accomplish SPX +3336.36
It is VERY OBVIOUSLY looking to not be the case, but we CAN NOT go with the SURE THING fibonacci TOP CALLS I made 2x last year at 2821.77 in JAN ’18 and 2930.94 in SEP ’18 just because MY 3047.34 was not only accomplished, but was forced to be gapped over to start NOV and avoided since the NOV LOW was the NOV OPEN (3050.72)
There is still questions in the community as to if SPX 2872.87 in JAN ’18 was Primary III and we a-b-c patterned a BEAR RALLY for that 2940.91 SEP ’18 high before the c completed in DEC ’18 or if JAN ’18 was Major 3 of III, FEB (or 9 sessions) for Major IV of 3 and then a Failed 5th wave as we topped and sold off in OCT.
Lets assume my chart is wrong and it is SEP ’18 for Primary III topped with Major 4 of III (that -11.47% drop for the double bottom FEB – APR ’18) lasting 3 months and PRIMARY IV (OCT – DEC) lasting almost 3 months. 10years corrects in 3 months: TWICE? 👆 (“fool me” quote)
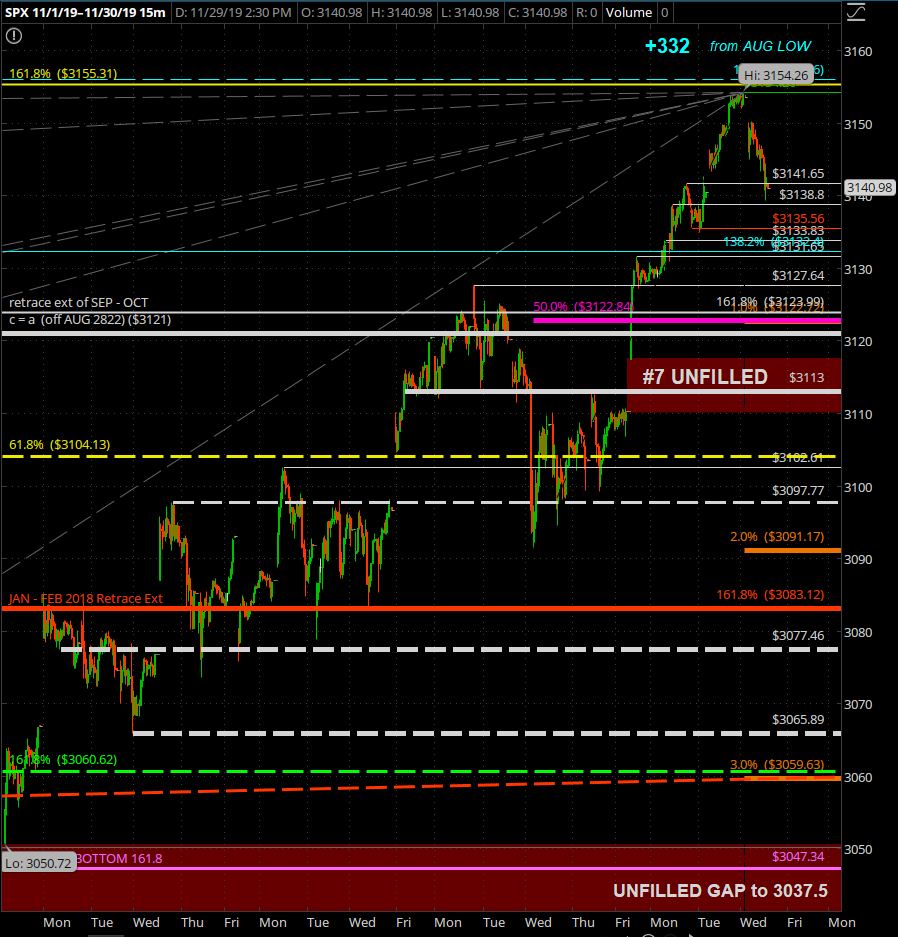
STOP……. NOTHING MATTERS UNTIL WE WALK DOWN THE SPX STAIRS:
3135
3131
3127
3122
3113
3110
3104
3098
3091
3083
3077
3065
3060
3050
And we STILL would only be breaking into ZONE 1 (3047.34 – 2930.94)

And STILL we WILL NOT have an overlapped wave low (2893 the highest one) so despite ALL of our upside targets hit with 3155.31 (161.8 retrace extension of the JUL – AUG drop) and 3155.75 (150.0 extension of AUG – SEP – OCT pivots), leaving just 3164 & 3179 left hanging above while the VIX is pouncing for an upward rip on every time frame

In Summary:
Upside has been forced for weeks (essentially all of NOV) and Wave 4 of MAJOR 3 of PRIMARY V should prove it is truly MAJOR 3 due to accomplish the final 5th wave targeting +3336 AS LONG AS 3091 DOES NOT BREAK.
Upside 3155.75; 3164.43; 3179.33 remain “available” with 3113 your WARNING and 3091 your CONFIRMATION they are off the table (for now atleast) while we STILL NEED to see VIX close (and stay) above 13.39. There is still the CATCH SUPPORT LEVELS @ 3083 then 3077 then 3056, 3060 and ultimately the NOV OPEN @ 3050 with the 6th of 7 UNFILLED GAPS SINCE 2893 @ 3037.5.
Some BEAR WHALES were spotted WED & FRI with some large out-of-the-money DEC 6 SPX & DEC 20 SPY PUTS so those who have the opportunity to be “up only” brainwashed need to let the OVERSOLD Daily come and provide you the entry if you want peace and tranquility.
The 1st sign that this wave 3 of Major 3 of Primary V is closed will be seeing IWM retracing back under 160 and GOLD re-attempting +1500. NQ sub 8000 will be a 2nd sign and as long as the DOW can support 27450 +/- 100, it should be assumed wave 4 is complete and the final (and unreliable) 5th wave of Major 3 to target +3336 is due to begin.
Common sense says sellers want to book gains in tax year 2020 rather than to book them in tax year 2019, thus a delay of any true downward momentum could be constricted based on this. However, The same catalysts for a sell off remain as they have for over 1-month and, with divergences or not, are just unused – until they are.
BULLS should be well prepared for a “dip” and feel no pressure to BTFD without a threat of the lower steps on the SPX stairs (3077-3065-3060-3050) and, having seen how much damage the Daily RSI(5) took on that small little -1.16% 2-day dip 2 weeks back: the Daily would most likely be oversold on a dip of ~100p.
A ~dip as such would also be a) in-line with the smaller dips since the JUN 3 LOW (-225p) with the AUG LOW -206p and then the OCT LOW -166p, and b) would summon in the support of the 50d MA (currently just under 3030). With 3 full weeks left in the year and which includes 2 celestial dates, one of which is OPEX FRIDAY DEC 20 and we have Friday the 13th in between with this week the JOBS report, how oversold we get matters heading into Xmas.
- December 3 (38/100 Long Terms Power)
- December 20 (100/100 Declinations Power)
- December 30 (98/100 Middle Terms Power)
ME PERSONALLY, having been there for the run into 2000 and down, the run into 2007 and down and with you all since the 2016 BOTTOM, I am looking and EXPECTING to see my ZONE 3 (2585 – 2565) no later than FEB 2020. An accomplishment of that will have eradicated all support lines besides those stemming from 2016 pivot lows and the DEC low.
A -50% drop into DEC 2022 from either here, where 2 + 2 = 🐟 or that MAJOR 3 MUST ACCOMPLISH +3336 for what will be a -50% to that ZONE 7 where the 161.8 retrace extension sits currently @ 1847 (+/- 50p) takes just one FOOLED 2x Baby Boomer to say “hey guys, you wanna lose it all a 3rd time?”
BEAR CALLS (Why they are AWESOME)
I have +45 stocks/indicies/ETFs on my screens so when you want an idea, just ask.


