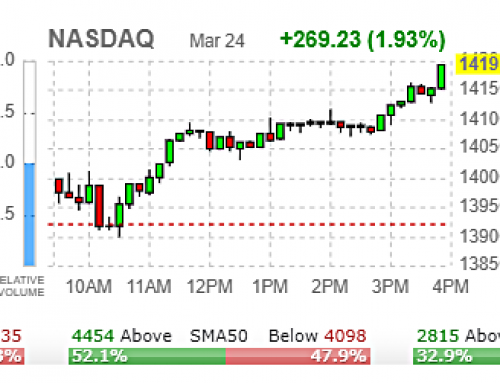
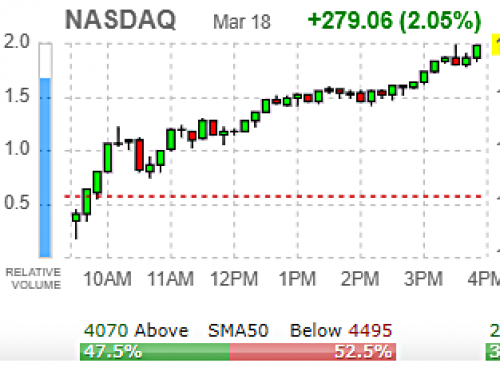
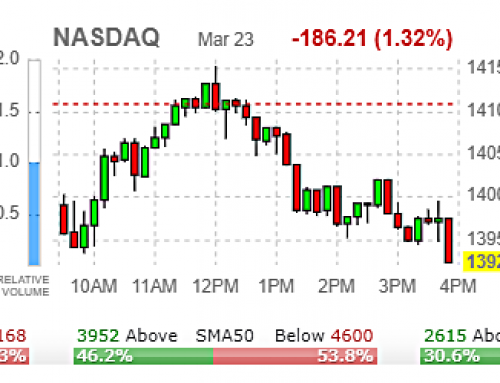
From Wednesday’s close:
- Dipping into Asian markets open; small little -20p move…
- Choppy little +10p bounce into midnight US time; not much to see…
- EU Futures open quiet; little revisit of the lows before they open…
- Sun rises in US; Back to Wednesday’s High with a little +6p atop it…
- 6am – 7am: flat and sideways with 1Hr little overbought
- 7am – 8am: flat and sideways with 1Hr little overbought
- 8am – Opening bell: flat and sideways with 1Hr little overbought
- Opening Bell “Ding Ding Ding Ding Ding”; COMPLETE FACE RIP for +35p into lunch

We got everything but the dip we wanted accomplished:
- Took out 50d SMA (red);
- Took out 50.0 retrace to ATH @ 2877.78
- Got both the SPY & QQQ “Fake Prints” from Monday (287.94 & 184.97);
- Took out Friday’s High (SPX 2891.31);
- Sniffed lower end of the “Risk Off” 2895 – 2920 range with the 161.8 fib extension from Mon – Wed
Its OPEX week and a FAILURE was expected (i.e. not taking out the already placed High of the Month), but we have a CLEAR 3 wave counter trend move (+51, -37.5, +77) with yesterday’s impulsive move to run out stops coming within 3p of the “Risk Off” range looking like all of the wave-b rally is complete.
Sure this can still morph upward for that range and pressure 2915 – 2920 Friday – early next week and even pressure 2931 – 2941, but I find it unlikely unless we see that dip that was expected yesterday to 2835 – 2828, but that would also be perplexing for the already bearish longer term technicals.
The BEST BEARISH SCENARIO would be for SPX to close above 2881 Friday to avoid a 2nd 🔻 RED Weekly candle. It’s not a requirement, but just preferred as its rare to get more than 2 consecutive 🔻 RED Weekly candles and see continued selling the 3rd week, but not impossible.
When OPEX Fails

So, we’re pretty much 💯assured of an OPEX FAIL tomorrow unless a US-CHINA deal is announced as there is no other way SPX surpasses 2954 without some unicorn = leprechaun.
For 2019, the OPEX Pattern has been the High of the OPEX Week – which had also been the High of the Month – came on Fridays into the close JAN – FEB – MAR with APR on the WED in what was a short week due to the Easter Holiday (No Friday session).
As we’re due a FAIL, I’m looking back at the previous 6 Failures:
MAR 2017: High of the Month MAR 1 followed by -1.93% dip (first real dip since election) to FAIL OPEX week by just 11p (+1.53% bounce). Final week of MAR, the LOW went in for the Month
AUG 2017: High of the Month AUG 8 followed by a -2.13% dip (2nd real dip since election) to FAIL OPEX week by 16p (+1.53% bounce). Following Monday, the LOW went in for the Month.
Remember, both MAR & AUG 2017 were in BULL TRENDS
FEB 2018: SPX just dropped -11.84% to start the month off from the then ATH placement JAN 26 for the 1st CORRECTION in almost 3 years. The FAIL OPEX week came on the Friday after a +8.75% bounce which then dipped the following week for a -2.06% drop before posting a Higher High of the Month (minus the initial drop off @ the start of the month).
- FEB & MAR were a messy DOUBLE TOP – DOUBLE BOTTOM into APR 2

OCT 2018
: SPX had just dropped -7.83% after a 2 week Multiple Top setup in that 2931 – 2941 range from the SEP 21 ATH into OCT 3. The FAIL OPEX week High came on the Wednesday and followed the sell down for a total -11.47% into the final week of the month.NOV 2018: High of the Month was placed the week prior to OPEX coming off that -11.47% sell down into OCT 29 which DOUBLE TOPPED the OCT OPEX Week High (2816.94 – 2815.15) and then sold down the following week for the OCT – NOV DOUBLE BOTTOM – very similar to FEB – MAR 2018.
DEC 2018: High of the Month started the Month and we had a picture perfect A-B-C whereas the C ended right on the reverse view 161.8 fibonacci extension (and some extremely strong larger time frame fibonacci retracements) – RIGHT TO -20% from the ATH:

SO WHAT DOES ALL THAT MEAN?
Predicting the future AIN’T (Analyze, Interpret, Number, Target) easy, but we do it pretty darn good and we were already heading into this week with the expectations of an OPEX FAIL and preferred view swapped over to all of 2019 off the DEC LOWS having been a BIG BEARISH B wave to target the DEC LOWS or LOWER.
Let’s Look BULLISH and for that +3000 move everyone and their grandmother has been told is coming since we broke above 2800 in MAR…
IF this entire move off the DEC LOW is in fact PRIMARY V whereas MAJOR 3 completed at 2954 and MAJOR 4 is underway before the final MAJOR 5 wave to end the entire BULL CYCLE off the 2009 LOWS and break above the Dotcom – 2007 Highs @ 1555 from 2013, then a > -10% CORRECTION is appropriate as we saw in FEB.
IF this entire move up from the DEC LOW is in fact a BIG BEAR B WAVE and we’re due to test/break the DEC LOWS to complete it, then a > -10% CORRECTION is an appropriate start as e saw in OCT.
MAKE SENSE? Here’s what it looks like:

IF we have the OPEX FAIL High in yesterday, that same exact DEC reverse fibonacci extension view which pegged the BOTTOM with the 161.8 fib extension, then here we have our projection for 2645.08 which is just fractionally > -10% (2658.72) – just fractionally shy of those FEB & OCT LOWS (-11.84% & -11.47%).
That’s NO COINCIDENCE in my Book of Reality
BULLISHLY for a MAJOR 4, we already expected to see the MAR – FEB Lows retraced to so that would call for 2722.22 – 2681.83 which still lines up.
BEARISHLY, that ~10% dip would still be a supportive level simply because of how the algos have worked seeing 8 visits from FEB – APRIL 2018 hit and support right at that then -10% level @ 2585.
In Summary:
Predicting the future AIN’T (Analyze, Interpret, Number, Target) easy, but we do it pretty darn good and this is by far NOT A PERFECT SCIENCE. However, having been inside this algo like Lawnmower Man for the last 2 years, coincidences in patterns usually come out to be results.
SPX can still morph for a higher high and pressure that 2920 – even pressuring 2931 – 2941, but the risk increases incrementally for each point above the already in 2892 OPEX High.
I got involved in MAY 24 SPY 285 PUTS yesterday using ONLY the PROFITS from the SMALL SPY CALLS plays this week as I a) am already positioned strongly for what I believed months back was a BIG BEAR B wave forming and b) to lead by example of how not to go over risked for the expected dip on the OPEX FAIL.
I also started a very small JUN 21 SPY 275 PUTS position for a BULLISH dip to ONLY the MAR – FEB LOWS which, from a math view if C = A:
- 2954 – 2801 = -153
- 2892 – 153 = 2739
Again, this can still go higher and there is no definitive proof of the drop completed and we’re heading higher into JUN without some proof @ 2835 – 2828 without breaking it. Break 2835 – 2828 and we’re more likely in the described above for 2720 – 2680 minimum into JUN.


