The cannabis industry scored a landslide victory November 8 as four states legalized recreational marijuana and another three approved medical use, cementing the 2016 election’s place in the history books. The developments could lead to $7 billion – $8 billion in additional annual retail cannabis sales, according to Marijuana Business Daily’s preliminary estimates.
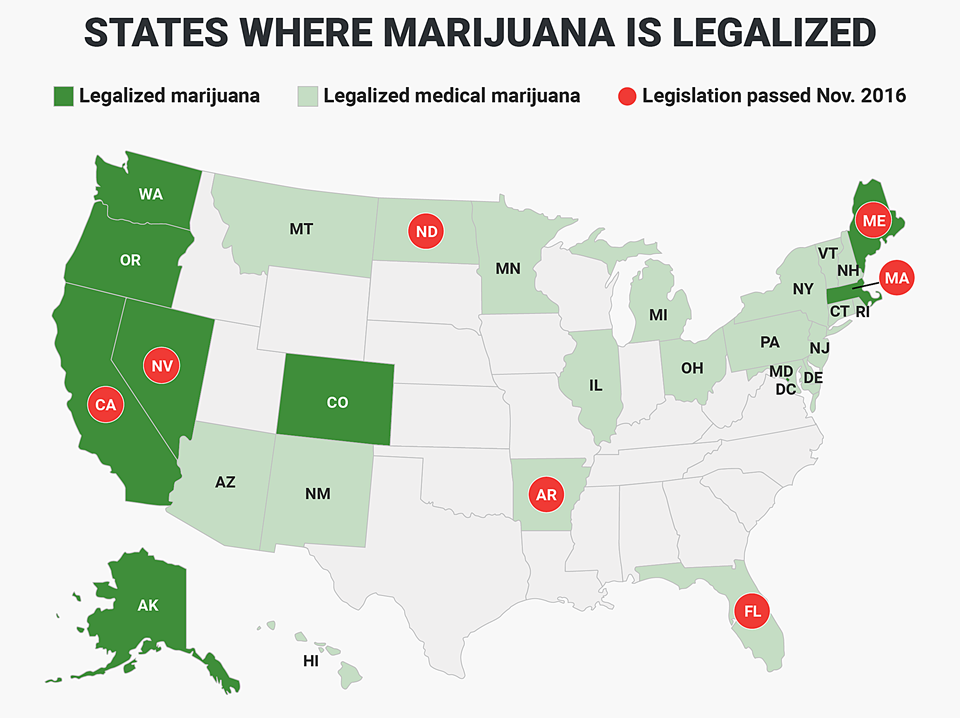
California, Maine, Massachusetts and Nevada voted to legalize recreational marijuana, while Arkansas, Florida and North Dakota approved medical cannabis initiatives. Montana, which legalized medical marijuana in 2004, also passed a measure to set up commercial cultivation operations and dispensaries.
Prior to the Elections, CNBC published an article titled “Investors seek high returns in marijuana stocks.” For those who were in the game back in 2012, you may recall how the granddaddies of today’s list of marijuana stocks (PHOT, MJNA, CBIS, HEMP, TRTC) all surged incredibly when the 2012 elections voted to legalize marijuana in both Colorado and Washington State.
14 months later, on January 1, 2014, sales began in Colorado and the OTC Markets blew up with virtually every real or fake company in the industry surging over 1,000% prior to April 20 (420) and dozens of POS diluting ticker changing their business model to the marijuana sector from whatever they were said to be focused on. You didn’t need a business location, sales, or even staff, all you needed to do was issue a statement saying you were going into the sector and KaBooom!
Post-Election Marijuana States
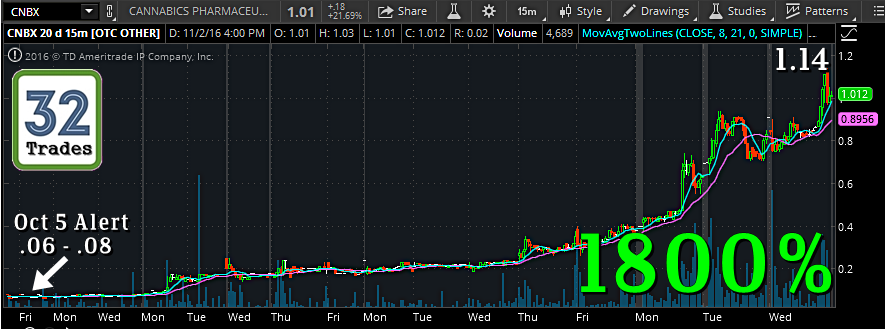
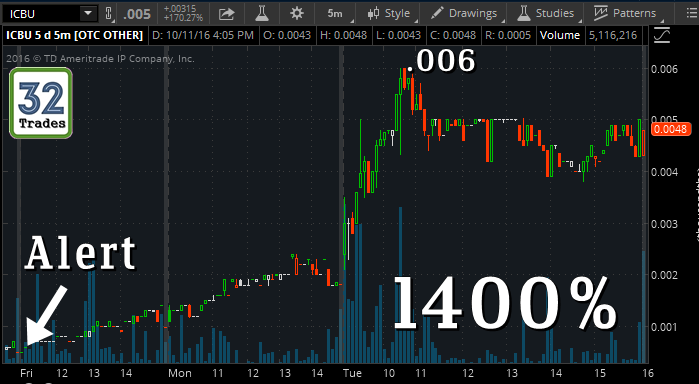
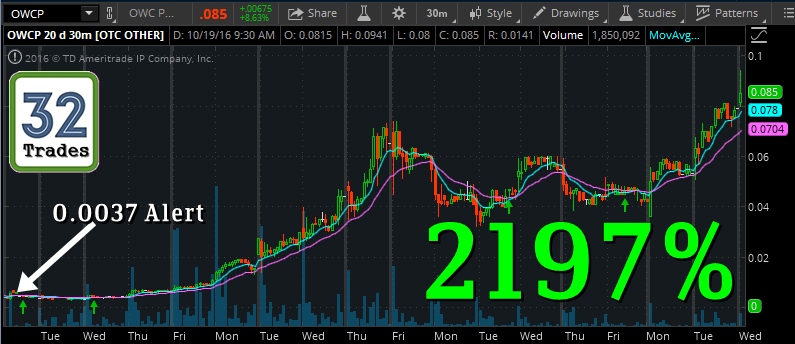
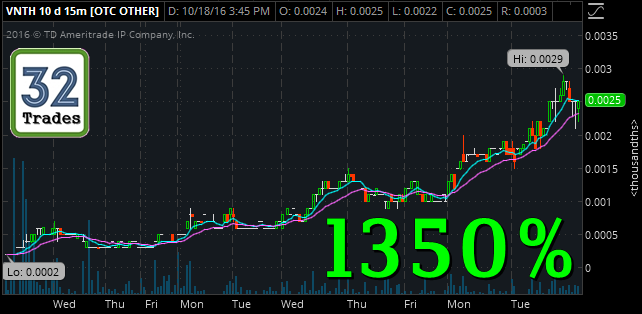
Since it’s already proven to be effective with our alerts on OWCP, CNBX, VNTH and ICBU, all gaining over 1350% from the alerts, Marijuana Stocks are going to be hot for the next couple of months and again when those states who legalize it for recreational use begin sales.
Top Marijuana Stocks Traded
| Symbol | Last | % Chg | Volume | $ Volume | Trades |
|---|---|---|---|---|---|
| CARA | 9.99 | +0.20 % | 1,187,233 | $11,984,477 | 6,470 |
| VBIO | 4.09 | +69.71 % | 2,228,380 | $7,658,584 | 4,354 |
| CBIS | 0.0685 | +21.45 % | 84,132,420 | $5,288,343 | 4,110 |
| MJNA | 0.1593 | +8.03 % | 55,097,787 | $8,717,581 | 3,824 |
| NDEV | 1.33 | +41.69 % | 5,499,456 | $5,843,060 | 3,695 |
| MCOA | 0.0669 | +30.96 % | 51,502,048 | $3,406,375 | 2,291 |
| CNAB | 1.6 | +23.08 % | 1,977,989 | $3,126,767 | 2,267 |
| AMMJ | 1.12 | +38.27 % | 3,860,600 | $3,746,967 | 2,043 |
| TRTC | 0.309 | +11.15 % | 8,833,652 | $2,661,579 | 1,634 |
| XXII | 1.14 | +1.79 % | 813,085 | $921,799 | 1,483 |
| HEMP | 0.0344 | +14.67 % | 39,549,129 | $1,292,177 | 1,424 |
| CANN | 3.07 | -4.66 % | 656,266 | $1,885,423 | 1,254 |
| MCIG | 0.17 | +21.52 % | 9,168,633 | $1,479,029 | 1,146 |
| MYDX | 0.0035 | +86.47 % | 189,878,842 | $525,937 | 917 |
| MSRT | 0.952 | +3.48 % | 1,545,295 | $1,490,448 | 906 |
| CVSI | 0.4166 | +28.18 % | 2,894,023 | $1,142,509 | 822 |
| ERBB | 0.0023 | +6.73 % | 247,211,982 | $593,742 | 818 |
| GRNH | 0.0891 | +17.24 % | 11,721,993 | $983,590 | 764 |
| PHOT | 0.0116 | +24.73 % | 43,829,234 | $431,220 | 645 |
| PMCB | 0.147 | +11.79 % | 4,513,824 | $650,003 | 569 |
| MJTK | 0.0027 | +23.64 % | 109,355,048 | $319,737 | 561 |
| KAYS | 0.28 | +9.80 % | 1,660,505 | $451,875 | 484 |
| EAPH | 0.0219 | +28.82 % | 16,196,977 | $310,761 | 465 |
| VAPE | 0.0123 | +24.24 % | 30,047,115 | $332,073 | 464 |
| OWCP | 0.18 | +16.96 % | 3,029,647 | $519,304 | 459 |
| CBDS | 5.27 | +0.76 % | 130,336 | $694,276 | 436 |
| KSHB | 2.86 | +0.35 % | 154,303 | $440,575 | 392 |
| ACAN | 2.2808 | +23.96 % | 197,830 | $415,458 | 381 |
| AGTK | 0.0316 | +12.79 % | 11,643,104 | $373,143 | 325 |
| SGBY | 0.0274 | +19.65 % | 11,510,658 | $296,264 | 310 |
| SRNA | 0.183 | +7.90 % | 1,109,435 | $199,092 | 277 |
| INCC | 0.0018 | +20.00 % | 88,311,703 | $144,762 | 275 |
| AXIM | 8 | +2.96 % | 69,180 | $567,306 | 267 |
| CNBX | 0.705 | +12.15 % | 459,088 | $319,793 | 263 |
| GBLX | 0.328 | +9.33 % | 1,224,087 | $386,364 | 247 |
| NEWC | 0.0136 | -14.00 % | 10,248,553 | $143,176 | 216 |
| MNTR | 0.6757 | -0.63 % | 301,109 | $219,703 | 196 |
| NGBL | 0.0002 | -33.33 % | 113,820,417 | $33,315 | 159 |
| GRCU | 0.028 | -2.10 % | 2,735,168 | $76,428 | 144 |
| USMJ | 0.0003 | -12.50 % | 127,121,591 | $47,188 | 136 |
| MYHI | 0.04 | +17.30 % | 1,177,962 | $46,510 | 128 |
| LXRP | 0.2908 | +22.34 % | 226,087 | $62,211 | 118 |
| GRWC | 0.99 | +32.00 % | 82,071 | $75,416 | 109 |
| VPOR | 0.0005 | +11.11 % | 55,193,623 | $28,896 | 101 |
| TAUG | 0.005 | -9.09 % | 5,679,137 | $28,651 | 97 |
| AERO | 3.8601 | +2.94 % | 43,978 | $173,247 | 95 |
| FTPM | 0.0012 | +100.00 % | 34,094,454 | $31,178 | 93 |
| ICBU | 0.0033 | -19.51 % | 4,797,740 | $16,459 | 84 |
| UBQU | 0.0143 | +5.30 % | 3,364,092 | $43,597 | 83 |
| SING | 0.0125 | -1.03 % | 3,804,385 | $45,138 | 73 |
| ACOL | 0.0032 | +18.52 % | 7,419,003 | $22,676 | 68 |
| TURV | 0.46 | +15.00 % | 99,386 | $45,952 | 62 |
| BAYP | 0.0002 | 0.00 % | 367,628,944 | $39,662 | 60 |
| EDXC | 0.0424 | +13.07 % | 808,876 | $30,359 | 60 |
Here is an alphabetical list below the two top traded charts for those who wish to dig in and take the chance to get high:
MJNA 5 Min – 10 Day Chart
MCOA 5 Min – 10 Day Chart
Marijuana Stocks Alphabetically
Chart View w/ Yahoo Finance Link

