

I’m going through my old dotCOM comparison charts to where we are today and counting weeks, looking at chart patterns, proving fibonaccis and I had a way way way back plot I hadn’t clicked for the 1.618 extension until just this morning:

If it FAILS and we do like the dotCOM & Current you’ll see below – GREAT! But finding this made me NEED to share it immediately with GDP pumping going on all week and AAPL maybe getting 4 days of BUffett on CNBC next week.
This 161.8 fib extension in PINK @ 2390.94 comes off of the OCT 1987 BEAR MARKET BOTTOM (216.46) to the MAR 31 2000 dotCOM PEAK (1552.87) to the OCT 2002 BEAR MARKET BOTTOM (768.63).
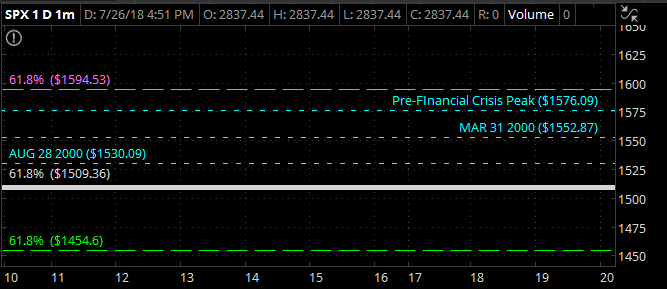
It ONLY caught my attention when I was going back over that DOUBLE TOP to the dotCOM PEAK we put in OCT 2007 when the start of the financial crisis kicked in whereas the 61.8 extension off that (1594.53) just missed getting hit @ 1576.09.
The 61.8 retracement from that OCT 1987 LOW and the dotCOM peak peg nearly perfectly to the MAR 2009 most recent BEAR MARKET bottom (726.97) as in we broke through it MAR 2 2009 and were back above it on MAR 12 2009.
The PLOTS off that and the fibonacci extensions are precision when you draw then as you will see, in that 2008 – 2009 bottom hunt, we broke through the OCT 2002 LOW on NOV 20-21 2008 and then FEB 20 2009 to that 61.8 retrace to the MAR 9 LOW (666.54) and were back up above all of them MAR 20 2009.
HISTORY IN THE MAKING
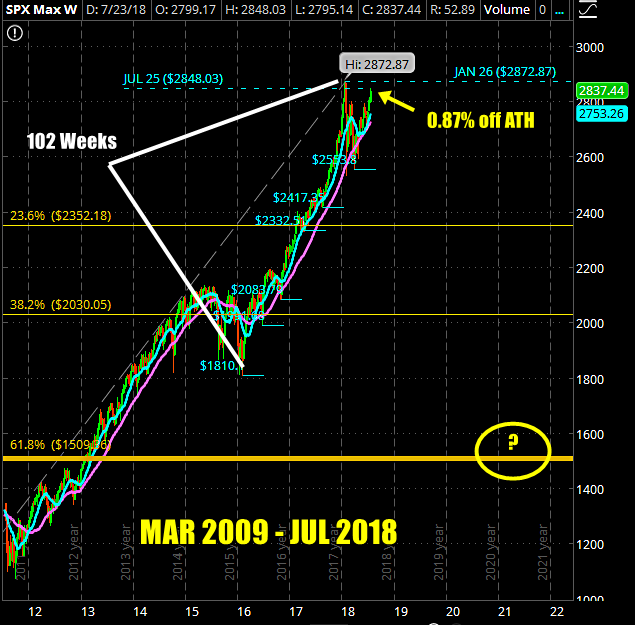
Either way, if that 2931 does manage a slither, the charts are still the charts in the current time frame we’re looking at and it is ABSOLUTELY DOABLE as we added a few weeks to the DEC 18 (17) count when we went euphoric in JAN 2018 and we have that “historic August Peak” the market sometimes likes to put in as we did last AUG 8 hitting 2491 before a -3% pullback.
The RETRACEMENT PLOTS in the LARGE SCOPE and looking back at historic trends for “BULL MARKET ENDS” – the 161.8 extension off the actual “dotCOM” run plots to 2564 which we’ve already seen prove in FEB & APR.
The BIGGER VIEW has that cluster 2378-2331, but when you PULL BACK and see the BIGGER PICTURE, the 61.8 retracement to the MAR 9 2009 LOWS and the 61.8 extensions off the 1987 & 1994 to the dotCOM peak plots all lead back to…..
1509 – DEAD SMACK TO THE dotCOM & Pre-Financial Crisis Highs
dotCOM Run (Weekly)

Current Run off MAR 2009
BEAR MARKET Pull Back Zone: 1600 Pennsylvania Ave. to Start
GREAT STUDY ON BULL/BEAR MARKETS HERE: