
Message me in CHAT any individual stocks you have or are watching for
- TERMINOLOGY: ES = S&P Futures; YM = DOW Futures; NQ = Nasdaq Futures
💲2️⃣0️⃣0️⃣️ Challenge: www.32trades.com/200-trade-
 10yr @ 1.255
SPX Friday AUG 20 Data:
-
Overnight Gap: +4.76
-
Range: 37.55
-
Open -Close: +31.11
-
Close -Close: +35.87
-
LOD > Previous Close: +1.00
-
Previous Close > High: +38.55
-
ATH > Close: -0.86%
-
ATH > LOD: -1.64%
-
YTD (Close) 2021: +17.98%
-
HOD Off MAR 2020 LOW: +102.77%
-
YoY: +31.61%
-
Month of AUGUST: +0.79%
SPX POST OPEX PATTERN BELOW SHARED ALL LAST WEEK
-
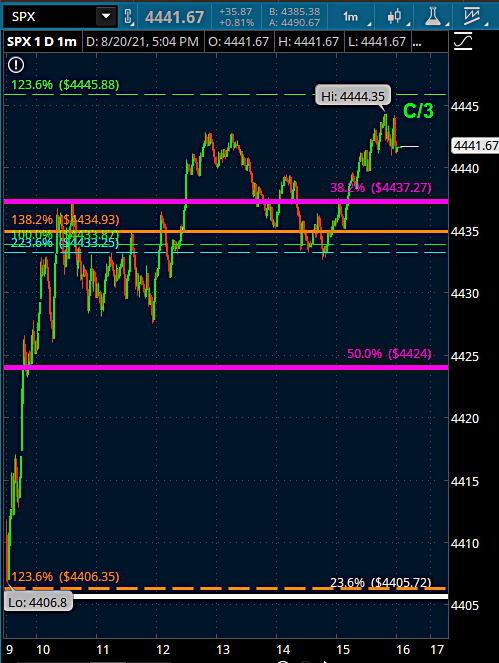
Looking at a 3-3-5 Flat Correction to be conservative rahter than a 5-3-5 Zig Zag which I can produce the 5 waves down instead of the 3

FLATS (3-3-5)
A flat correction differs from a zigzag in that the subwave sequence is 3-3-5, as shown in Figures 14 and 15. Since the first actionary wave, wave A, lacks sufficient downward force to unfold into a full five waves as it does in a zigzag, the B wave reaction seems to inherit this lack of countertrend pressure and, not surprisingly, terminates near the start of wave A. Wave C, in turn, generally terminates just slightly beyond the end of wave A rather than significantly beyond as in zigzags.
Flat corrections usually retrace less of preceding impulse waves than do zigzags. They participate in periods involving a strong larger trend and thus virtually always precede or follow extensions. The more powerful the underlying trend, the briefer the flat tends to be. Within impulses, fourth waves frequently sport flats, while second waves rarely do.
Three types of 3-3-5 corrections have been identified by differences in their overall shape. In a regular flat correction, wave B terminates about at the level of the beginning of wave A, and wave C terminates a slight bit past the end of wave A, as we have shown in Figures 14 and 15. Far more common, however, is the variety called an expanded flat, which contains a price extreme beyond that of the preceding impulse wave. In expanded flats, wave B of the 3-3-5 pattern terminates beyond the starting level of wave A, and wave C ends more substantially beyond the ending level of wave A, as shown in Figures 16 and 17.
In a rare variation on the 3-3-5 pattern, which we call a running flat, wave B terminates well beyond the beginning of wave A as in an expanded flat, but wave C fails to travel its full distance, falling short of the level at which wave A ended. There are hardly any examples of this type of correction in the price record.
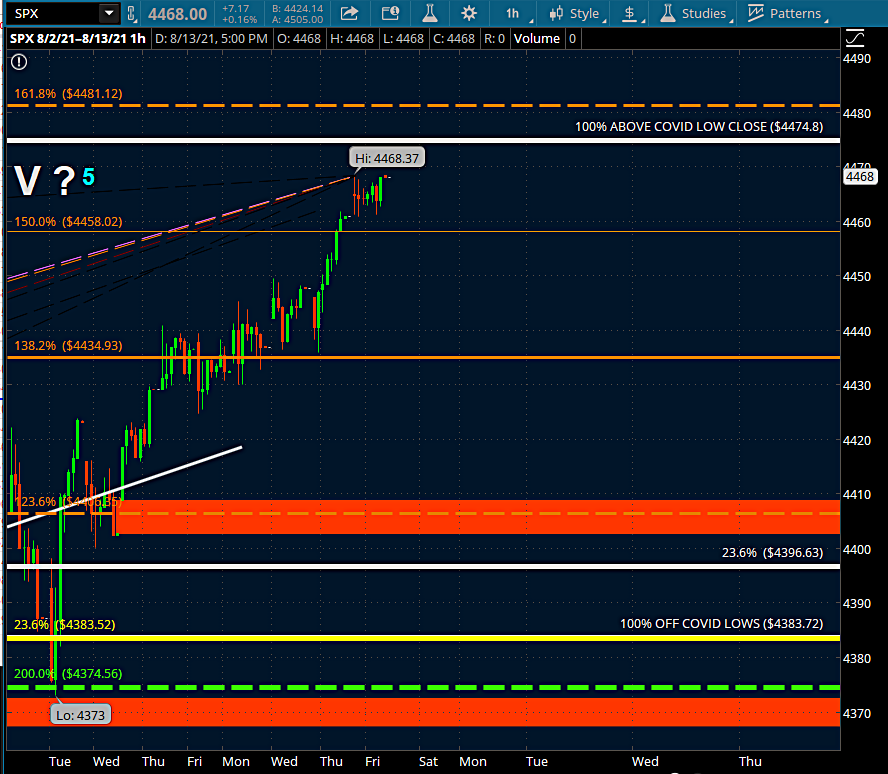
Thus being CONSERVATIVE: SPX 4368 (last week’s low)
ZIGZAGS (5-3-5)
A single zigzag in a bull market is a simple three-wave declining pattern labeled A-B-C and subdividing 5-3-5. The top of wave B is noticeably lower than the start of wave A, as illustrated in Figures 11 and 12.
Occasionally zigzags will occur twice, or at most, three times in succession, particularly when the first zigzag falls short of a normal target. In these cases, each zigzag is separated by an intervening “three” (labeled X), producing what is called a double zigzag (see Figure 13) or triple zigzag. The zigzags are labeled W and Y (and Z, if a triple).
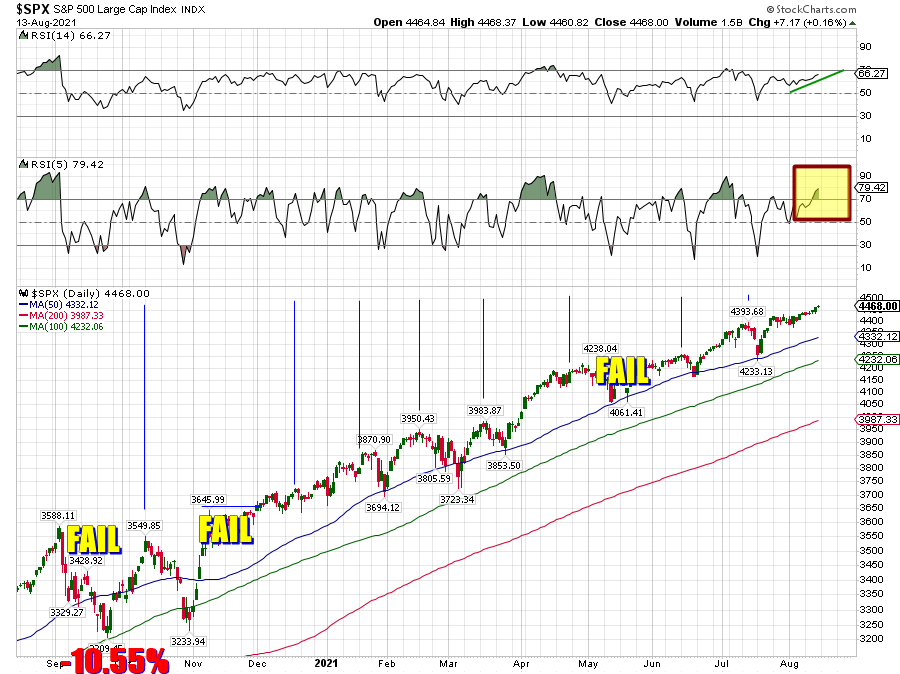
AGGRESSIVE (considering we’re coming to 1yr from the SPX 3588.11 SEP 2., 2020 that started the last -10% correction S&P 500 had…
SPX 4180 – 4004

You look there at SEP – OCT 2020 and you see a 3-3-5 FLAT so it’s prudent to consider this is not the end of the 100yr CYCLE or this CYCLE started in 2009
There are arguements that support ALL of the CYCLE is in, but we’re going to remain conservative and consider this the III topping, the IV starting and then we get V which likely goes until the mid-term elections next year or atleast into Q2 2022
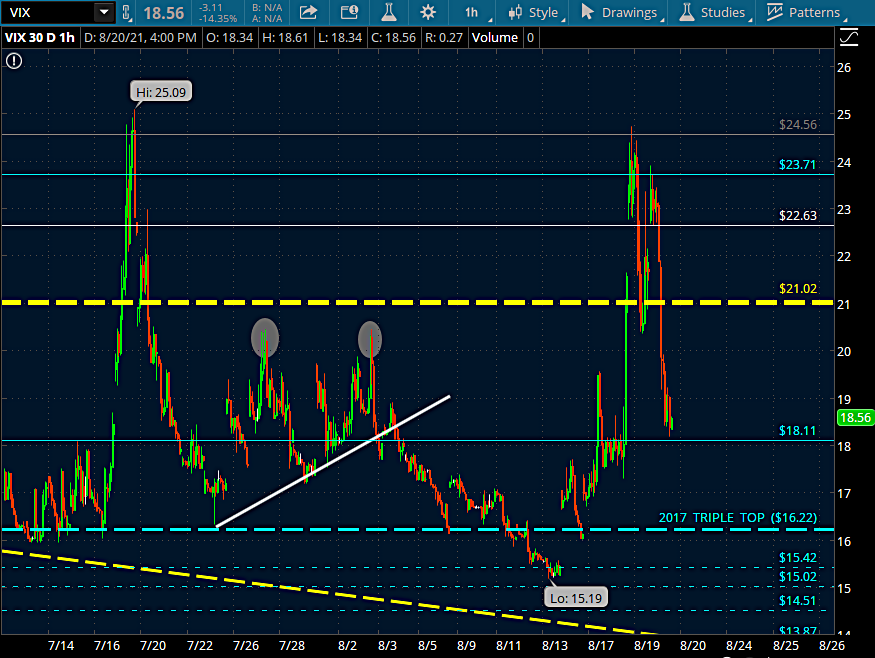
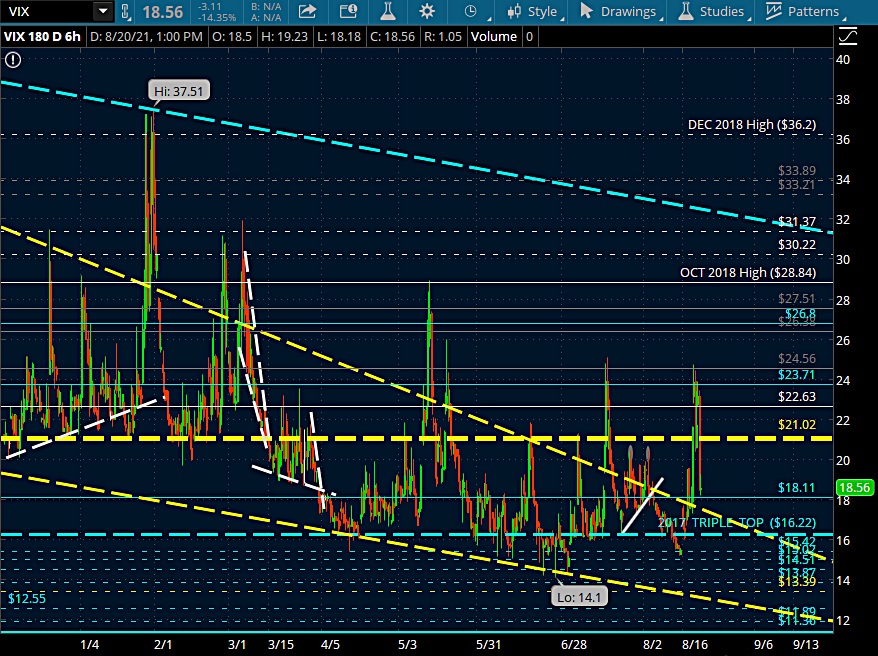
VIX +18 supports CORRECTIVE VIEW

So in a quick overveiw summary:
We have the BRAINWASHED knowledge that every gap above fills and that is still open for SPX 4480 while the Post Opex Pattern I’ve only shared from OCT 2020 fits for a decline this week into the start of SEP
The end of this week is Jackson Hole and Powell speaking
Jackson Holes have many times been SELL OFF COMMENTARY CATALYSTS
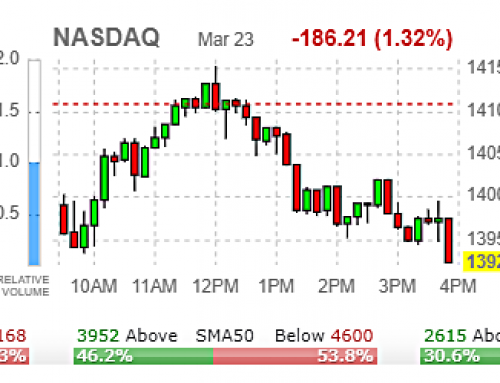
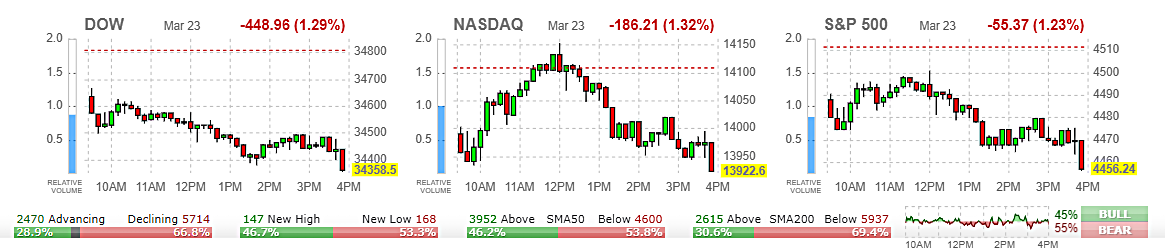
The RALLY Friday FAILED SPX +4458 and was done via MSFT, NVDA & NFLX
QQQ +365.49 is a BULL TRAP with 362.55 the BEAR LINE

——————————
We’re FOCUSED On The OPEX PATTERN

OPEX is the Monthly Options Expiration and happens every 3rd Friday of every month
I’ve tracked OPEX since JAN 2017 and was how I was able to warn that if we didn’t drop by Tuesday last week, it wasn’t going to happen and we’re virtually guaranteed to post hgher highs this week on SPX/SPY
That said, there’s also the POST OPEX PATTERN HIGH POSTING pattern
Going to BIDEN’s TIME only and since its most applicable being it’s where this wave began, I’m showing here the POST OPEX HIGH DIP as the TRADE FOCUS
NOV 2020

See on the Daily above and that DOUBLE BOTTOM to the SEP 2020 LOW here on OCT 3o and we have where out wave-C FAILED and wave-1 begins
NOV 2020 FAILED with a DOUBLE TOPPING to the BIDEN WIN / Pfizer VAC (within minutes announced each)
But those there are the low for those who PUTS LEAPS of the 22/23 unfilled gaps which will fill
DEC 2020

With OPEX there’s QUAD WITCHING OPEX which are those 3rd Friday’s of MAR, JUN, SEP & DEC. Note how the DOUBLE BOTTOM SELL OFF after OPEX back to the LOW OF THE MONTH – HIGH OF NOVEMBER:
-2.42% sell off starting Friday and ending the next trading session: Monday
JAN 2021

Identical to JAN 2018 with the TOP of the month coming the final Friday of the month and selling off -4.57% JAN 26 – 30, the OPEX High post on the Thursday of OEPX Week dipped -2.01% on OPEX Friday which if I recall oversold our 4hr for the BTFD
FEB 2021
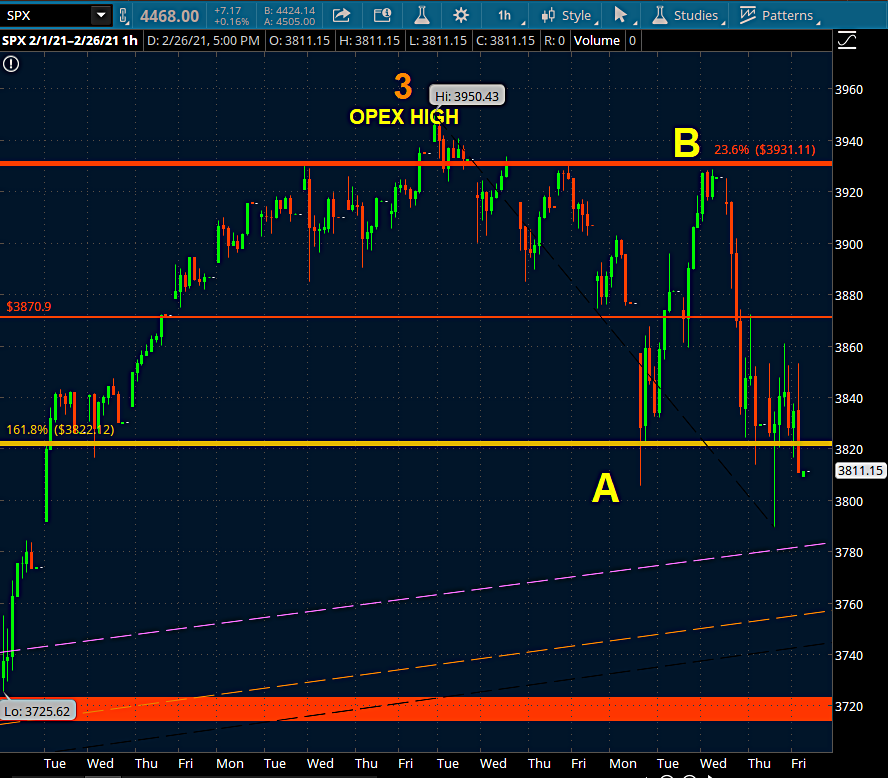
OPEX High post on the Monday into what wound up being a -5.75% (the largest correction this year) correction into the MAR LOW which every elliot wave tech agrees was the wave-4 low from the OCT 30 wave start
MAR 2021
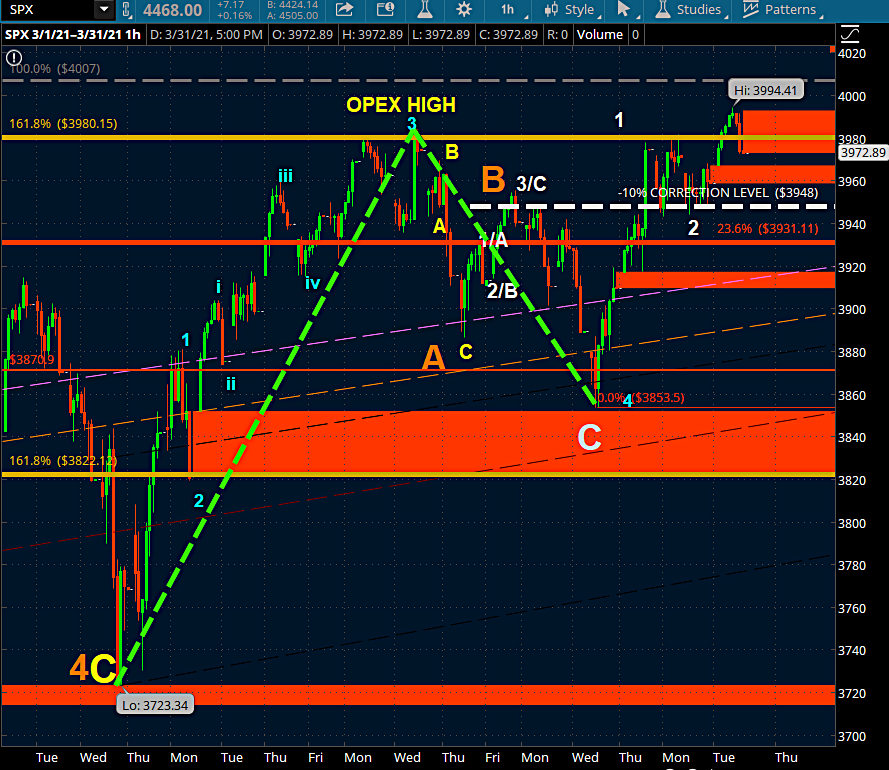
Massive BTFD alerts on MAR LOWS, right up into the OPEX PATTERN print on the Wednesday of OEPX WEEK. The post Opex Pattern dip: 3983.87 – 385350: -3.27%
APR 2021
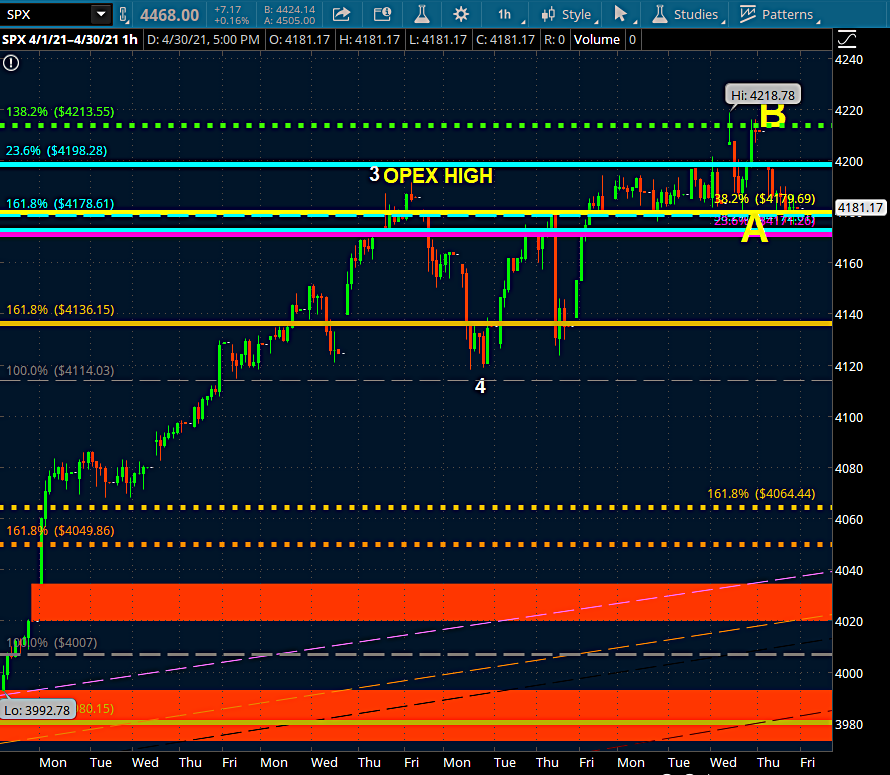
Earnings Season start month; OPEX Patterned into the Friday with the -1.74% dip ending the Tuesday after
MAY 2021
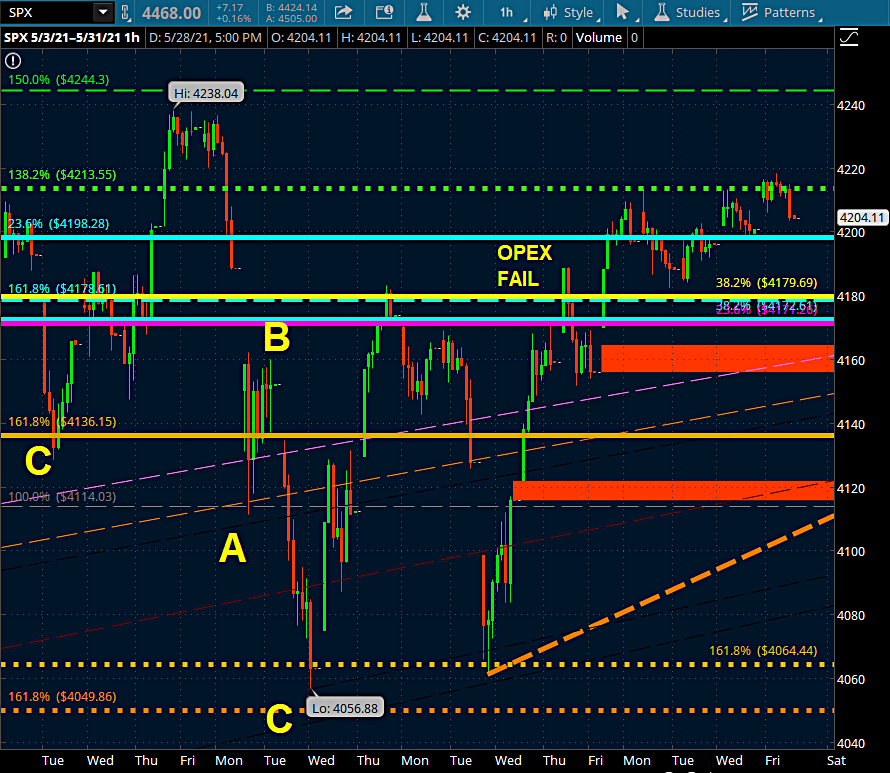
MAY FAILED by collpasing -4.27% after the MAY 10 All Time High – the latest late into the month OPEX Failure going back to JAN 2017
The DOUBLE BOTTOM BTFD during OPEX Week Failure is where the final leg of this wave-5 of wave-v of wave-III began there: 4061.41
JUN 2021

1 of 5/v/III topped OPEX Week Tuesday with a -2.18% dip ending Quad Witching Friday (4164.40) whre the 2 pivot is
JUL 2021

wave 3/v/III just shy of the 123.6 pivot on OPEX Week Wednesday with the A-B-C 4/v/III 4233.13, -3.65% dip, ending the Monday after OPEX Week and your last true BTFD LONG alerts
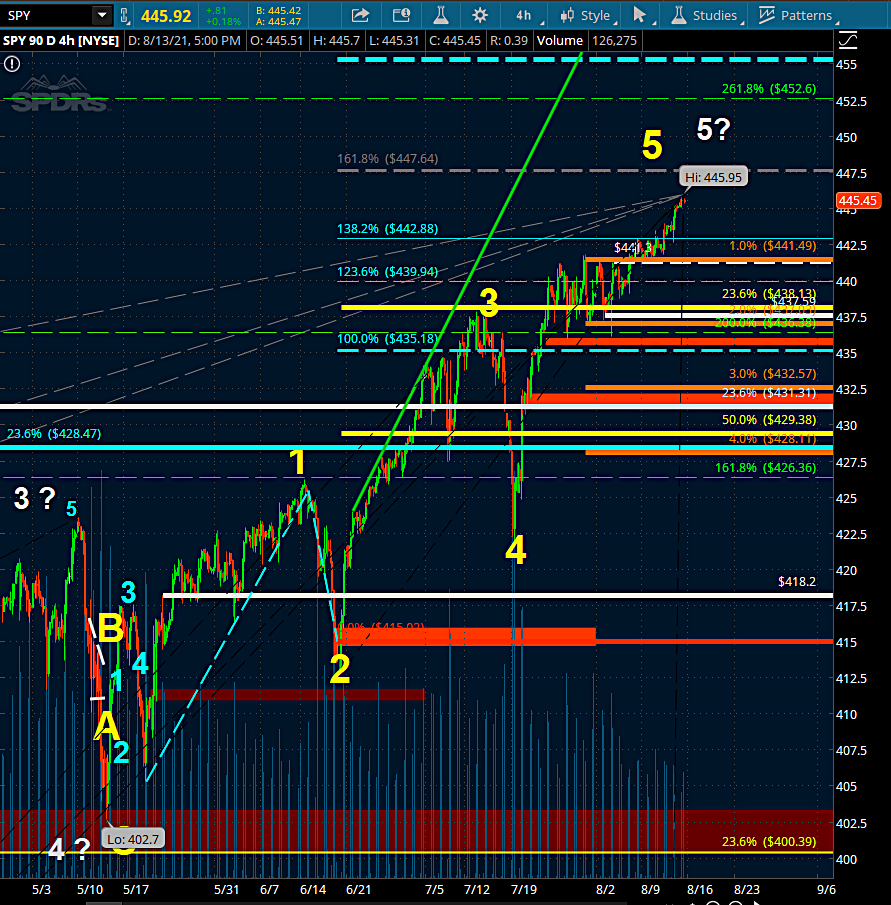
From it we’re chartting this is 5/v/III to complete the wave III from OCT 30 2020
AUG 2021 Current:
So:
4474.80 is 100% above the MAR 2020 LOW CLOSE
4383.72 is 100% above the MAR 2020 LOWS and we’ve traded above that for 15 consecutive sessions as of Friday
4,424.74 is last week’s LOW and currently a -0.98% dip from 4468.37
4481.12 is the most attractive upside fib pivot: 161.8 of:
-
MAY LOW
-
JUN OPEX HIGH
-
JUN POST OPEX DIP
Above 4481.12 are:
-
4492.90: 161.8 retrace of the JUL DIP and very algo attractive
-
4493.41: 238.2 ext of the OCT – NOV 1-2
-
4504.82: 250.0 ext of the MAR 2021 1-2-3
Last week SPX went 4437.77 – 4468.37 with zero energy despite how bullish that move appears and while the DOW has done more work than the Nasdaq and the Russell is wanting to confirm its wave-C to complete this 5 month long correction:
IWM

In Summary:
SPX above 4468.37 is best suited for 4474.80 – 4481.12 and then a decline of > 1% which from 4481.12 would be -44.81 or 4436 which we had as resistance and is now the 1st support
On SPY: 447.64 with that UNTOUCHED LAST WEEK 441.30 below