
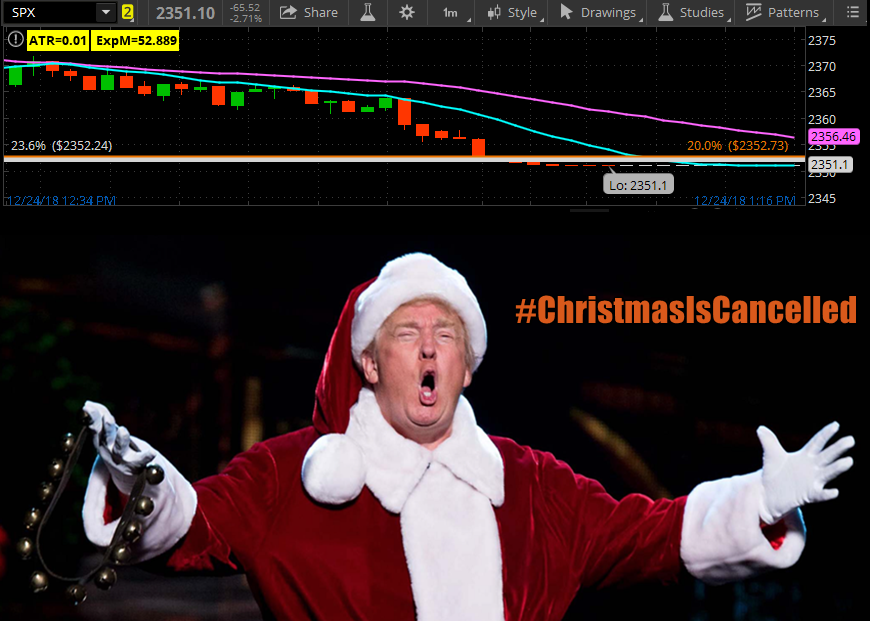
The rumbling, stumbling, bumbling of the markets continued through that possible algo joke of a DEC 21 LOW on Christmas Eve, but it did a few things which were very eye opening…
We went into Monday with “PLUNGE PROTECTION TEAM” trending on Twitter thanks to Treas Sec Mnuchin’s “Liquidity Call” over the weekend that went viral – literally Dingleberry, Dingleberry, DIngleberry Dropping all the way into the close for the very bottom of my adjusted final zone: 2352 from the original 2362.

That Mnuchin Effect delayed the typical DEC 24 start of the annual Santa Rally usually begins, letting the Satan Selling continue through some pivotal breaking points, but there might just be some strong possibilities for a Santa 2000 week ahead:
PROS CONS
- pegged -20% line -449.08p since start of DEC
- pegged original 23.6 retrace to 2009 LOW -234.19p since FOMC spike/reject of 2586
- pegged MONTHLY 50 MA to the penny lost AUG 2017 LOW @ 2417.35
- RSI(5) 3.74 is > the OCT 11 3.04 reading 8 consecutive LOWER CLOSES, 12 of 14 this month
- 200 MA on WEEKLY just -3p below largest HIGHER CLOSE of the month: +14.29
- looks like 5 completed waves down from 2585 ZERO BUY SIGNALS ANYWHERE ON ANYTHING
- back under middle of 2009 – 2016 channel 161.8 retrace of the original ATH JAN still lower: 2280.41
- the 23.6 retrace to 1987 BLACK MONDAY LOW is 2297.94
- 2009 – 2016 CHANNEL SUPPORT roughly 2300’ish
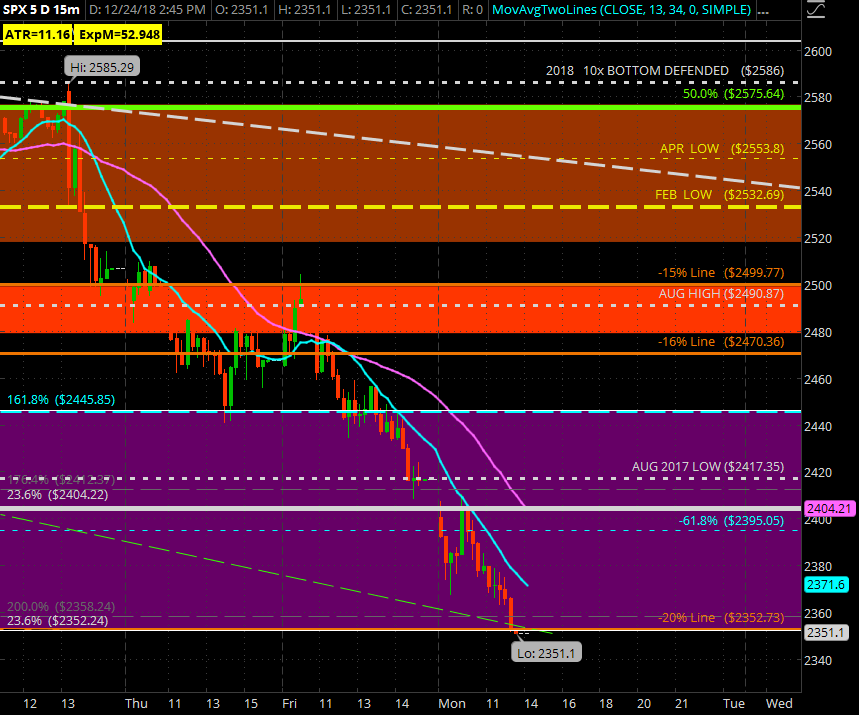
There are 3 SIGNIFICANT LOWS which start with the -20% line (2352.73) and 23.6 retrace (2352.24) from the JAN ATH (2872.87) to the FEB 9 LOW (2532.69):
- 2352.72 MAY 2017 LOW
- 2332.51 APR 2017 LOW
- 2322.25 MAR 2017 LOW
These play a key role for the market algos (imho) as we had that 109 consecutive session streak without a -1% decline day (which we NAILED), and based within that 31 point range: 2353 – 2322 and could finally trigger the bounce which is overdue.
Above, from that MAR 1 2017 High (2400.98) to that AUG 2017 LOW (2417.35) was an area I was looking to see rebound and possibly would have Monday had it not been for the Mnuchin Effect which even trickled over to Japan’s NIKKEI for a Christmas morning -1000 point drop; -5% intraday lows, that just about matches up with where the SPX ended off: through its 23.6 to the 2009 LOWS and fractionally through the -20% line

14 Day RSI Below 20%
SPX closed below this Monday for the second time since the SEP 21 ATH with the first being OCT 11 (the anniversary of the 2002 BEAR MARKET LOW). In the past 10 years, we’ve broken that 20% line 4 times:
- 2 this year: OCT 11 and Monday
- AUG 24-25 2015: the “Lucy Passport” crash (Oil was dropping and China stopped buying US T-Bills just like now)
- AUG 8 2011 after that 3-month, -19.63% decline (see the similarity to the current time frame).
Going from the oldest, the initial bounce in 2011 was worth +9.35% over a 5 session span before finally putting in the positive divergence on the Daily with the fractionally lower low 2 months later. You gotta remember: we were still below the DOTcom (1552) – 2007 (1576) ALL TIME HIGHS DOUBLE TOP
AUG 24-24 “Lucy Passport” crash was a 6 session, -11.24% drop which many attribute to the illuminati secret code within the passport shown on screen in the movie “Lucy” which featured Scarlett Johanson and Morgan Freeman (lines right up with the same Matrix Neo passport Illuminati conspiracy). A 3 session, +6.77% rebound for a 50.0 retrace of the drop resulted, but wouldn’t clean up until a HIGHER HIGH and then DOUBLE BOTTOM a month later on SEP 29 which lead to the attempt revisit/break of the then ATH before dropping LOWER for the FEB 11 2016 LOW (14 Day RSI was only 34.59 on that)
OCT 11, just 10 weeks ago when SPX printed 2710.51 for the LOW after a 6 session, -7.8% drop and the initial leg down of this BEAR MARKET: a -229.35 point drop. The subsequent 4 session produced a +106.43 point bounce or +3.93% rebound, before posting lower lows 2 weeks later for that “a” bottom @ 2603.54.
Can Santa Bring A +161.80 Point Bounce?
I picked 161.80 because I saw us break and come to 3 STRONG 161.8 extensions:
- 2478.62, 2472.77 and 2444.15
If you go off the Christmas Eve close low of 2351.10 and add 161.80 to it, you get a +6.88% rally which fits for prior 14 Day RSI below 20% runs, the prototypical SANTA CLAUS RALLY and it takes SPX to 2512.90 and just outside of the low end of our #1 Dingleberry Drop Zone: 2568 – 2521.
Fits too with the DOTcom fade to the DEC 21 LOW OF THE YEAR which rallied +6.86% from it into the DEC 29 HOD. This +3 month start to the eventual 2002 BEAR MARKET BOTTOM actually rallied into JAN 31 2001 to almost revisit the DEC 2000 HIGH before dropping off the cliff into MAR 2001.
For reference: the 14 Day RSI @ 20% was never taken out during the DOTcom fade off into the 2002 BEAR MARKET BOTTOM until the SEP 11 tragedy when markets closed for 4 sessions afterwards.
We then broke that indicator line again at the end of JUL 2002 prior to the lower price low for the BEAR MARKET BOTTOM which set up the wide view BUY DIVERGENCE on it.
In Summary:
These are DANGEROUS TIMES and I still stand by the weekend update that LOWER LOWS are still going to come before we set up the positive divergence (maybe we have it now, but it’s forcing it if we do). In the past +20 years since the DOTcom HIGHS, only 6 times has the 14 Day RSI @ 20% been broken: the 4 mentioned above of which 2 are in the last 3 months; SEP 11 2001 and just prior to the 2002 BEAR MARKET BOTTOM.
Can it Bounce > or < than 161.80: ABSOLUTELY.
Can it NOT BOUNCE AT ALL? ABSOLUTELY.
Will This Ever Bounce? ABSOLUTELY!
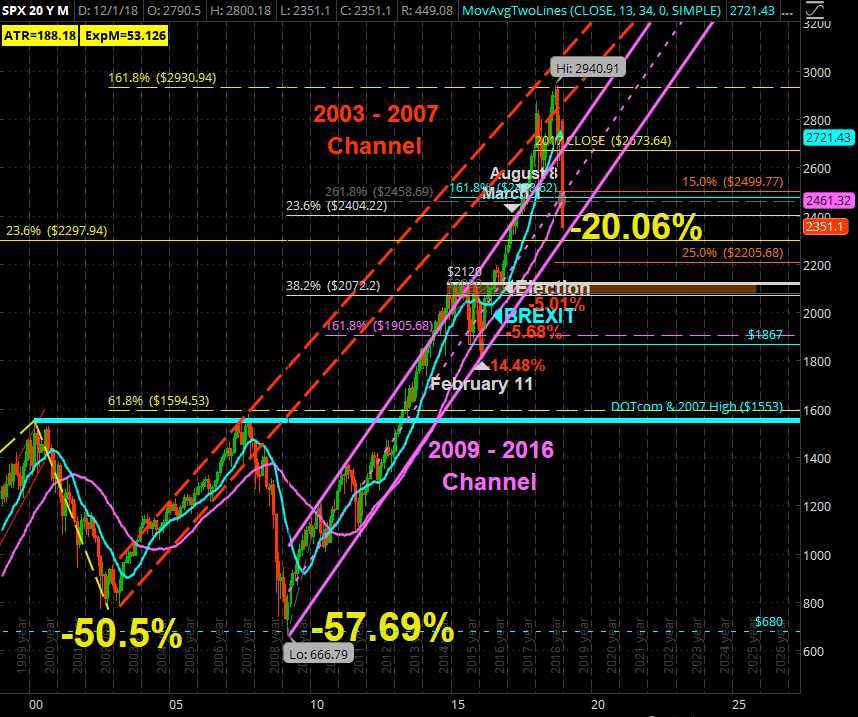
A few of you saw in the #32options_alerts room Monday how I started getting some SHARES LONG and some CALLS LEAPS on SPY, AAPL & AMZN. Time is SUPER CHEAP right now and although it isn’t by any means a sure thing, I like the set up still for a LOWER LOW in JAN/FEB after a bounce that sets up a positive divergence and then the MAJOR-5 for a large number of the top tickers and the likely capping off of the SPX @ +3000 before the REAL DROP back down to 1552 – 1576 for that -50% market decline to match the 2000 – 2002 and the 2007 – 2009 declines: -50.5% & -57.69%
When viewing the 20Yr Monthly, you have to ask the unanswerable question:
DID THE BULL MARKET BEGIN ON THE 2009 LOWS OR AFTER THE DOTcom – 2007 HIGHS BROKE?
SPX Channels: 20Yr Monthly
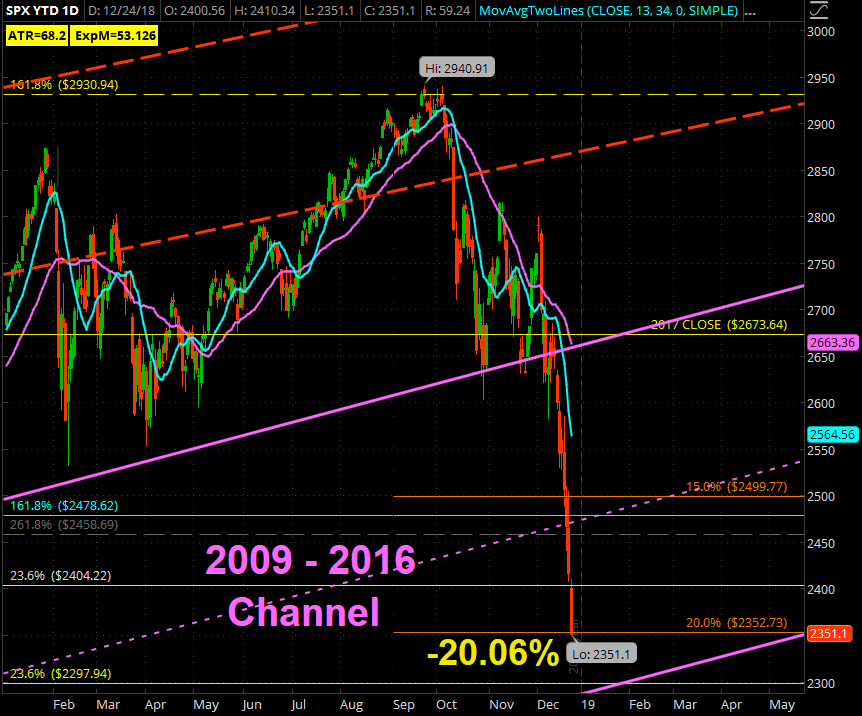
SPX Channels: YTD Daily


