

Welcome traders to the final week of the month, quarter and half year which comes with some hidden codes which are still to be revealed. You all know how we nailed the September 9, 2016 dump day, the March 21 dump day, and recently, the June 9 Nasdaq Tech Sector dump day. Well heading into this coming long 4th of July weekend, we have some “still to be proven” scenarios with some planetary collusion timed with them.
Before running over the patterns I’m seeing on the SPX, QQQ and IBB, here’s what’s lining up in the stars as we head into this weekend:
- June 30 (100/100 Declinations Power)
- July 4 (100/100 Middle Terms Power)
These planetary siderograph turning points typically indicate market turning points within 4-7 calendar days rather than being exact to the day of the turning point. When two powerful dates fall within 4-7 days of themselves, they can provide for a very powerful directional move; assuming both are in directional agreement.
1. Declination refers to the angular distance of a planet north and south relative to the celestial equator, which is in the same plane as Earth’s equator. Therefore, if you are standing on Earth’s equator, if the planet appears in the north it will have a positive declination, and if it appears in the south it will have a negative declination.
Come June 30, SATURN, would be aligned directly SOUTH of the earth (see here) which would be cause for a NEGATIVE DECLINATION.
2. Middle Terms Power refers to, what is best worded as ” Intermediate Swings in Mass Psychology.” Longs Terms Power is considered long-term planetary relationships (Jupiter-Pluto through Neptune-Pluto) whereby all planetary relationships that are not long-term are therefore middle-term.
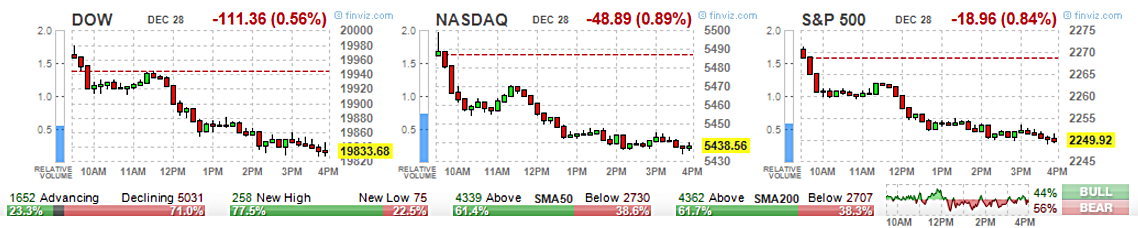
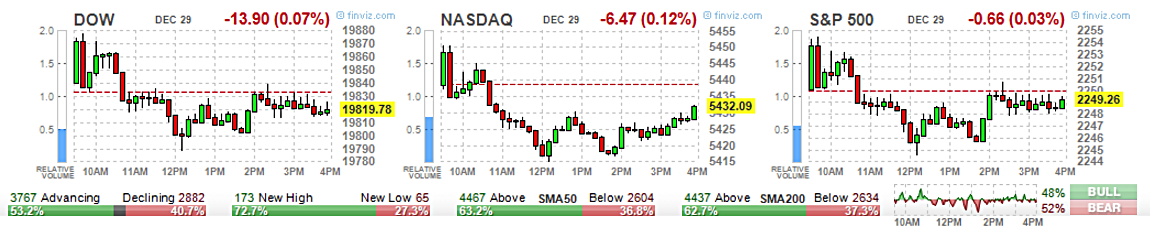
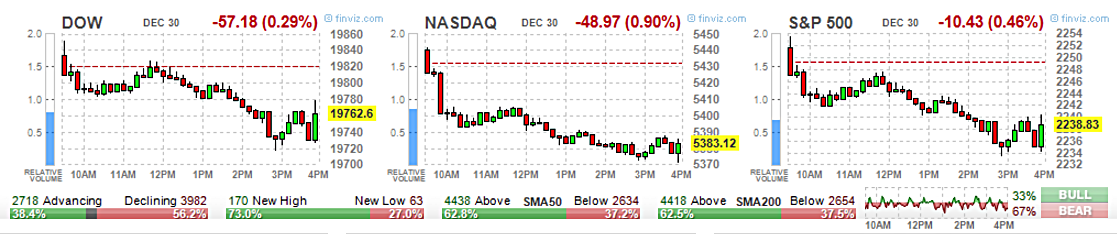
The last 2 100/100 Middle Terms Power dates we had were on October 19, 2016 and December 28, 2016:
October 19: SPX closed @ 2144.29. 5Days later, it peaked @ 2154.79 and subsequently sold off to what we know as the “Election Lows” SPX 2083.79 on November 4: A -3.3% decline over the 3 week period.
December 28 (end of month/quarter/half year/year): That date pegged exactly on the day with a near -1% decline on the Nasdaq & S&P 500. SPX was hitting that multiple top area @ 2275 from December 13 – 27 (our SPX 2440 area these last few weeks). On December 28, SPX dropped from its 2271 high to December 30’s 2233 lows for a -1.77% decline from DEC 27 High to DEC 30 Low.
DEC 28 – 30
How To Trade This
As I pointed out in last week’s video of the SPY 245.01 – 245.02 DOUBLE TOP and then this past week, we had the SPX jump to new All-Time Highs only to pullback under 2440 again…
IF THIS SPX 2454 was the impulsive top for this wave/uptrend, the downtrend/correction to follow could be the largest of the entire bull market. The corrections since February 2016 have been about -5%, and about 80-120 SPX points. If the recent high at SPX 2454 ended the uptrend, then initial support should be at the 2321, 2286 and 2270 pivots (2454 – March 27’s 2322 = –5.38%)
My 23.6 Retracement from the NOV 4 Lows to Monday’s 2454 Highs pegs to 2366 (roughly SPY 237.61).
My 38.2 Retracement from the NOV 4 Lows to Monday’s 2454 Highs pegs to 2312 (roughly SPY 232.35).
My Next NEAREST Expirations on SPY PUTS is for JUL 21 (then AUG 18 then SEP 29)

For Any Of This To Happen
SPX first needs to break below 2416/2419 and stay below it. The day we nailed the last planet alignment trade, June 9, when the Nasdaq tech sector sold off big, SPX lows reached 2415.70, but rapidly rebounded back up above that 2422 line.
While technical indicators support the SPX 2454 uptrend high scenario we placed on Monday, there are negative divergences on the daily RSI/MACD and the weekly RSI/MACD as well. Typically that would be enough to suggest a downtrend is underway.
Adding to this possibility is a possible end to the 7-month uptrend in the NAZ at the recent high of 6342. As we saw on June 9, it sold off rapidly after that high and has negative divergences on both its daily and weekly RSI. The technicals support a correction scenario is next.
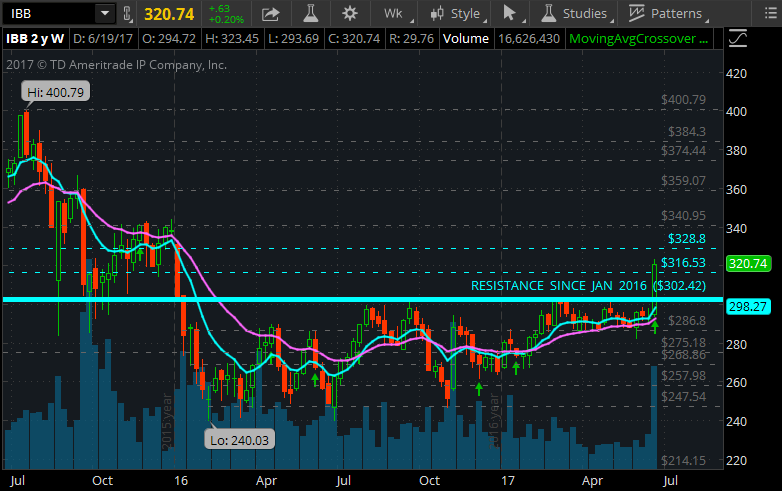
What’s currently preventing this is the recent boom in the drug/biotech sector which rotated funds into what is best seen on the IBB chart. Since the first week of January, 2016, IBB had not been able to stay at/above 302.42, yet midway through last week on whispers of the Senate’s plans to get the new Healthcare Bill voted on and passed before the 4th of July weekend (I think that’s when they said they would put it to vote) paused the possible downtrend scenario.
Banks (XLF) is already saying this is happening. Oil & Energy (XLE) is already saying this is happening. For it to happen, the DJIA needs to revisit and break below that MARCH 1 21169.11 line and the market needs to SAY NO TO DRUGS!
Why is June Important?
Here’s a look back at June since the market bottom on March 9, 2009:
- 2009: 6/8 – 7/9 -9.09%
- 2010: 4/26 – 6/28 -17.12%
- 2011: 5/2 – 6/13 -8.21% (-19.63% to 8/8)
- 2012: 4/30 – 6/4 -10.5%
- 2013: 5/20 – 6/24 -7.52%
- 2014: NONE (7/21 -4.35% then 9/15 -9.84%)
- 2015: 5/18 – 7/6 -4.25% (-12.08% 7/20 – 8/24)
- 2016: 6/6 – 6/27 -6.08% (BREXIT)
- 2017: 6/19 – 6/23 -0.94% ????????
All of the dominoes truly are there lined up awaiting a push so one could either preempt this move to come by speculating into some JUL 21 SPY PUTS or await true confirmation. In the event this all plays out as it appears to be ready to, I would not only be very conservative about upside CALLS plays into the end of the money, but also be scoping those recent bottoms my favorite stocks put in after the JUN 9 collisions of the worlds sell down and using those for the furthest away support levels:
- QQQ: 135.50
- IWM: 134
- FB: 144.50
- NFLX: 148.50
- AAPL: 142.80
- AMZN: 945
- GOOGL: 945
- NVDA: 145
- AMD: 11.50
- BABA: 134
- BIDU: 173.50
- GS: 211
- JPM: 82
- BAC 22
Regardless of IF we get this pullback or not, these here should all already be ALARMS within your trading platform for when to begin looking/getting/asking about a CALLS position.


