So it’s Labor Day weekend; The summer is officially over; College Football has started; Baseball is ending; We didn’t get SPY 220 (yet); and Donald’s Wall and Hillary’s EpiPen are leading topics into what’s just 2 months away:
ELECTION 2016
Rather than getting into how votes matter as much as thicker napkins on buffalo wing night since the U.S. has the Electoral College, I took some time to look back in order to look forward and we might have just stumbled upon an interesting pattern to develop…
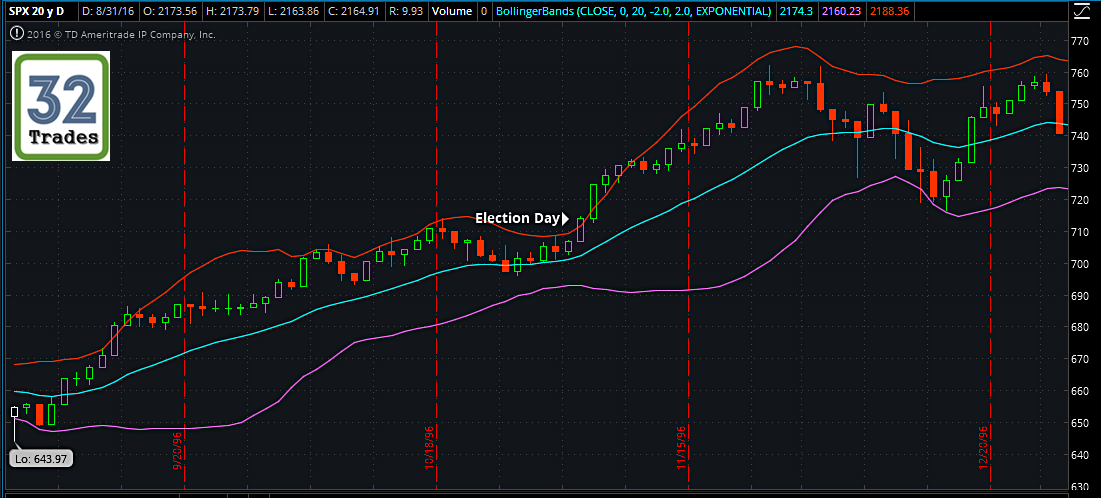
1996: Bill Clinton Re-Election
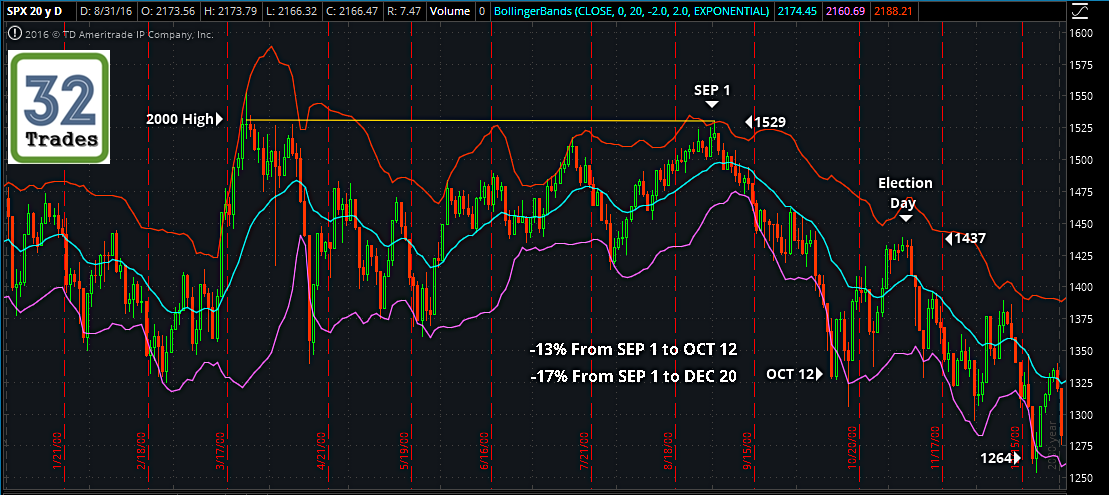
2000: George W. defeats “Internet Founder” Al Gore
2004: W. Re-Election
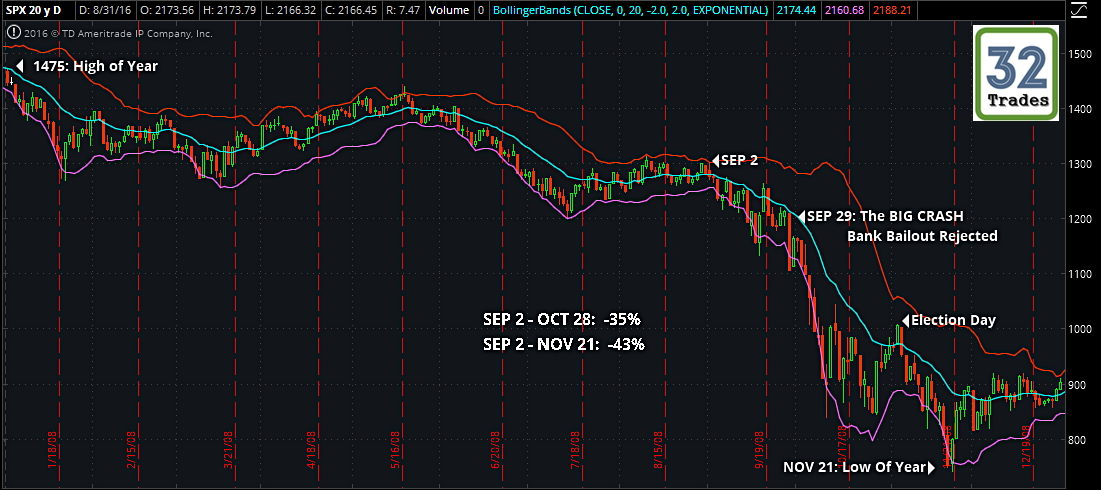
2008: Obama defeats McCain
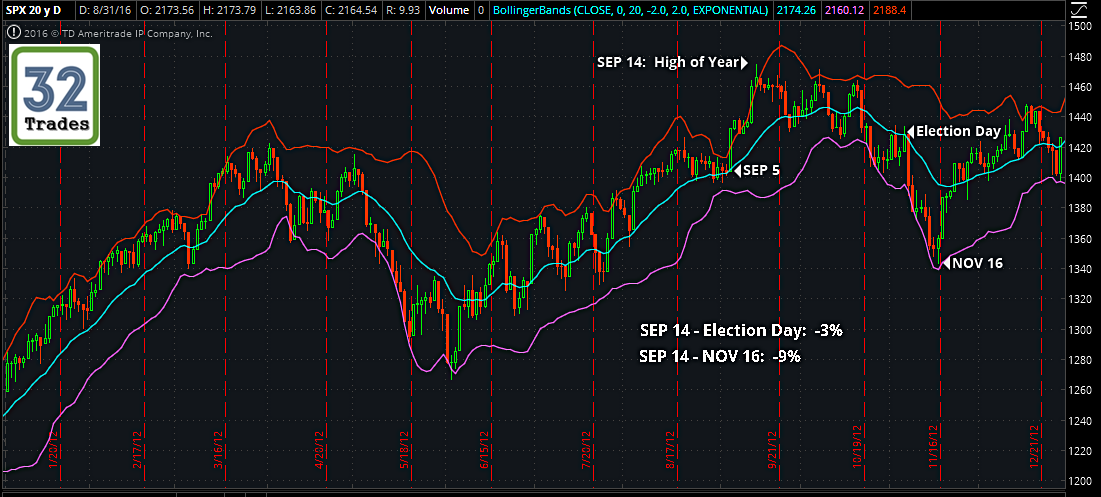
2012: Obama Re-Election
Today, September 2
Hmmmm….. Let’s look at some facts that pertain to these years:
1996
- The Internet only had 10 million active users, 35 million people used email
- There was just 12 online trading companies in 1994 (check them out)
- Clinton pushed for spending gaps which shut down the government twice in late ’95
- Unemployment dropped from 5.8% in March ’95 to 5.2% October ’96
- As if Bob Dole stood a chance against Monica Lewinsky’s stained blue dress
2000
- March 2000, the NASDAQ crashed following the collapse of the Dot-com bubble
- The “Recession” began towards the end of Clinton’s reign after 10 years of growth
- The Fed began raising interest rates “to protect the economy from the overvalued stock market”
- Unemployment dropped to 3.9% in September, matching the 30-year low
- The “EURO” was less than 2 years old
- SPX dropped -9.4% from Jan 1 – Dec 31
2004
- We’re still at war in Iraq/Afghanistan
- Annual GDP in Q3 of 2003 rose to 8.2%, the fastest pace since Q4 of 1983
- W. repeated his proposal to offer millions of illegal immigrants temporary legal status
- Oil had risen to $45/bl
- The Fed raised interest rates 0.25%, the 4th such hike that year, one week after the election
- SPX gained 9.95% from Jan 1 – Dec 31
2008
- The Great Recession: Financial crisis and U.S. subprime mortgage crisis
- From Oct 2007 – Oct 2008, interest rates dropped from 4.5% to 1.0% then to 0.25% in December
- Oil hit $100 in January
- Unemployment was rising: 5.0% in January to 6.5% in October and rose to 10.0% October, 2009
- October 3, W. signs the revised Emergency Economic Stabilization Act into law, creating a $700B Treasury fund to purchase failing bank assets
- SPX dropped -37.29% from Jan 1 – Dec 31
2012
- “The Year of No Surprises”
- Unemployment hovered around 8.0% for the year
- Annual inflation was just 1.8%
- The U.S. debt to GDP ratio reached 101%
- Debt grew more in Obama’s first 4 years than from George Washington to Bill Clinton
- SPX gained 16% from Jan 1 – Dec 31
Today
- We began the year dropping for 5 weeks -12.9%
- We climbed 21.3% in 8 months from 181.02 – 219.60
- We’re raising rates for the first time since 2004
- Unemployment is 4.9%
- New All Time Highs were set this summer on all but the NYSE
- We fell out of the rising wedge and weakly moved out of the declining channel entered into from 219.60
- We ended our 8th session without producing a new All Time High, the longest streak without one since that July 8 JOBS Data
- Since July 8, SPY was putting in a new All Time High in no less than 5 sessions after the previous one
- SPX gained 7.13% from Jan 1 – Sep 2
What’s Coming?
If you wear or don’t wear a tin foil hat when trying to decipher stock market codes, it seems quite clear that since the inception of online trading began, we “LIKE” re-elections, and “DISLIKE” a new Commander In Chief. Noting how the “CHANGE” was a different party each time the pattern displayed, the “Hanging Chad” results of 2000 were too close to call and needed recounting.
For you kids who were still in diapers, had it not been for W.’s brother Jeb having sexual relations with Florida Secretary of State Katherine Harris, the early “BUSH WINS” and eventual recount of the butterflies to show Bush did have 537 more votes than internet creator Gore would still have proven the CHANGE pattern.
Word Scramble TrumpClinton, You Get: Unicorn
He/She who wins in 2 months time is your call. IDFKTBH
Anyways, it APPEARS that when we have a change, we drop into October, bounce into the election, then drop in all but the Clinton and Bush re-elections. The Obama years need to have an *asterick considering the crisis created during both the Clinton and Bush years, but the pattern of a CHANGE and the post election week(s) do indicate drops following.
Clinton’s re-election had little to no online trading (volume/volatility) and Obama’s re-election year dropped -9% from mid September to just after the election.
September 2 (or near it) is noted in the charts for a reason: Labor Day and the end of Summer.
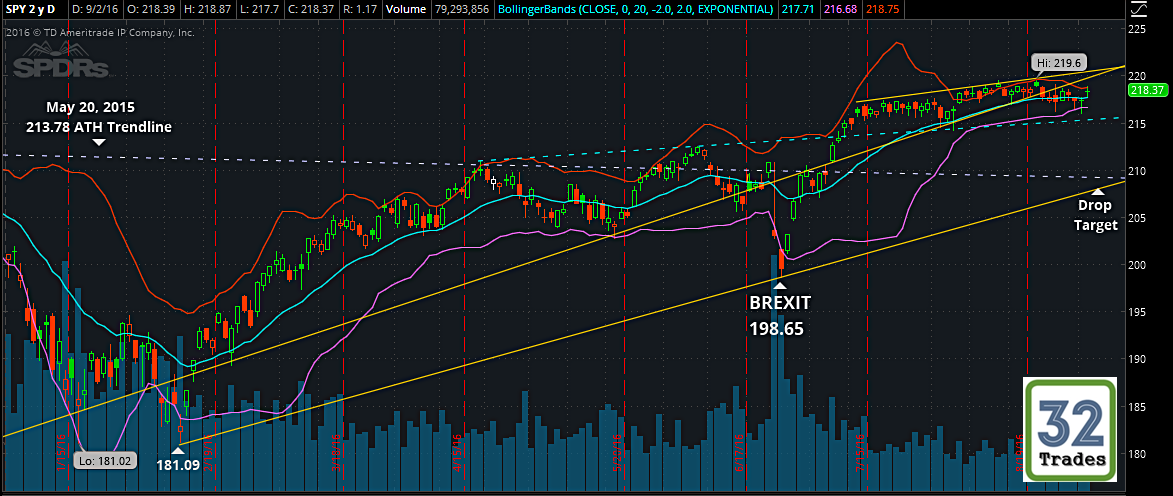
Using the Today chart, you can clearly see a declining trend line which originates from the May 20, 2015 highs that resists on April 20, again in May before bumping higher and returning, and again into and after BREXIT. The trend was broken through above on the June JOBS Data we got on July 8 which began this summer bull run to new All Time Highs after New All Time Highs.
If the tin foil hat election trend of CHANGE works within the prior year ranges in terms of percentage drops, that lower trend line from the February 11 low, double bottom divergence to the BREXIT low, it would be a -3.83% drop if it happened now. Since the is a rising trend line, it will continue rising as the days add up and likely act as a support line IF the pattern prevails.
The real target would likely be that declining trend line from the May 20, 2015 highs which drops just slightly enough that come October, that line should likely be around 208.5, a -4.52% drop from here today.
A DRASTIC drop similar to that in 2012, but far from the HORRIFIC drops of 2000 or 2008 (maybe if Trump wins), could take us down to the low 200s, high 190s. That trend line coming off the double bottom, March 2009 lows has us pegged to roughly 204-205.
Contradicting these possible scenarios, being that we’re RAISING interest rates, albeit slower than in 2004, a similar rise from September highs into the end of the year, a +8.5% move, would take us to 237. That would essentially have us repeating 20 years ago, +18% from Sep 2 to Dec 31 in 1996 – the year when the other Clinton was getting re-elected.
REALLY, this is all just something to consider having been brainwashed for the last 8 months (besides when I called the BREXIT drop) that SPY CALLS are all you can buy. Also BEAR in mind that a large number of the market crashes have occurred during September & October. #JustSaying
Check out here what typically is cause for a crash to happen. It’s rarely ever about who or what. I’m in no way predicting a “Black Swan” or Crash coming, but a dip into November seems likely.
As for the voting, I’d just go for Ron Jeremy if I was you…


