
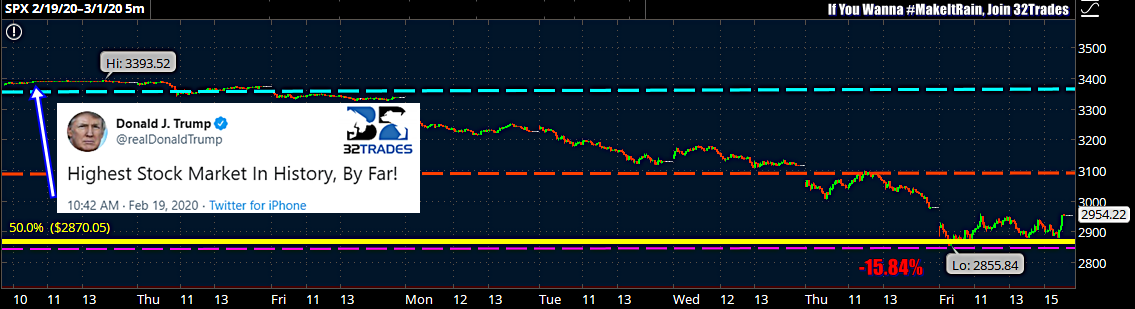
So the weekend update showed the “W” BTFD Patterns, but not under a microscope.
We just had 7 consecutive 🔻 lower closes from the previous close, but Friday posted a 🔺 close than the open (+37.32p) and we’ve seen the S&P Futures post a poor man’s high @ 3021 around 3:30AM today so things are looking 🚀 UP with global indexes green and even Italy is brushing off the VIRAL VIRUS down just -2.48%..
HOWEVER:
I’ve gone back to MAR 2009 and tracked the consecutive streaks of 🔻 closes and compared to 2011, 2012, 2013, 2016 and 2018…
THE VOLUME hit us in the beginning as compared to weak sell offs or build up sell offs like in 2018. What is even more recognizable is the BOUNCE (or end of selling) Pattern when viewing the close versus previous close:
- ONE GREEN DAY of about +30p
- ANOTHER RED DAY but really small one
- SMALL GREEN CLOSES START
Having already bounced +100p off the Friday DOUBLE BOTTOM to OCT and skim over the FEB – APR 2018 – JUN 2019 LOWS Line…. some STFU is appropriate when forming a biased opinion of the biggest % and fastest drop off the ATH (or any wave high) a over a decade

I’m looking for that 1st gap to be filled; a push as high as the 2009 BEAR BOTTOM line @ 3047 (which was gapped over end of OCT/start of NOV and never seen until Thursday last week). a real positive would be to close above 3000, but any close above 2994 would be considered a good sign.
Understanding there’s a decent chance for a fractionally 🔻 day Tuesday, those in short-term speculations may use this as a caution flag for overnighting.