
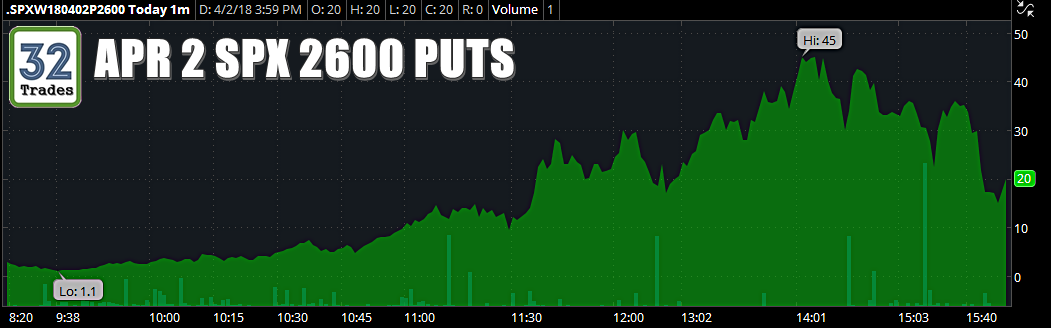
It may have been pretty selfish for the U.S. alone to enjoy the sell off Monday with the E.U. markets all closed, but when you get a chance to ride within 10-20-30-40 baggers to levels that stuck out like sore thumbs, who’s complaining.
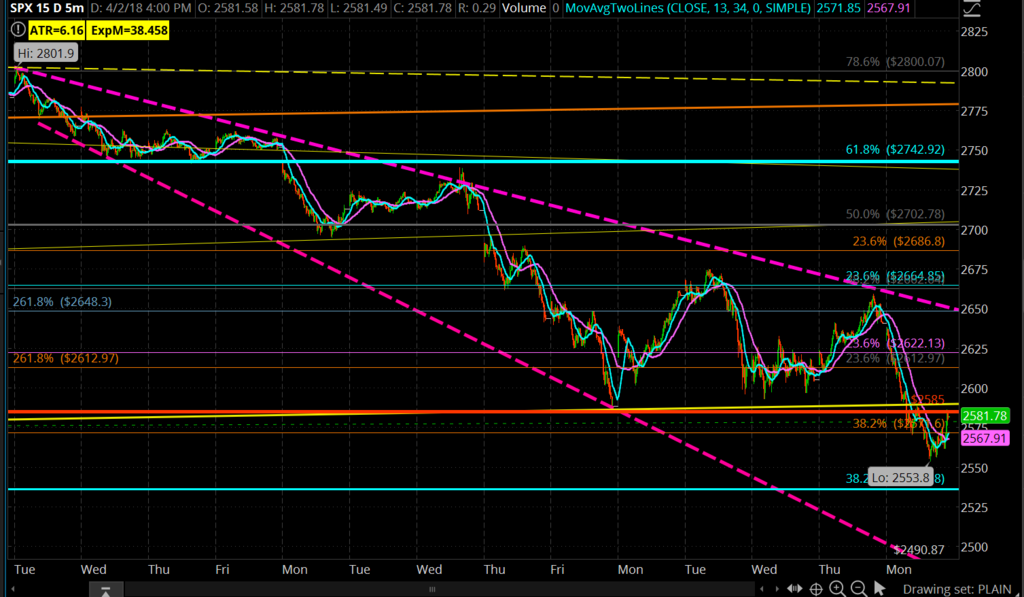
Using the EWT a=c count, SPX mid/upper 2400s are still wide open for this to find a proper bottom (with that 2491 sticking out like a BIG CATCHER’S MITT, but as we closed below the 200d SMA for the first time since BREXIT (which was a wild V-Shape rebound to higher ATHs within 2 weeks) some noteworthy points must be made:
SPX CORRECTION VIEWS
1: WIDE VIEW (link for full view)

2. 4Week View from 2802 (link fir full view)
Some QUICK Bullet Points to know:
- SPX closed under the 200d SMA (2589.85) – last time was BREXIT
- SPY closed under the 200d SMA (256.50)
- QQQ did not break the 200d SMA (152.21) – LOD 153.88
- IWM did not break the 200d SMA (147.07) – LOD 147.17
- DIA tagged the 200d SMA / DJIA broke but bounced above the 200d SMA
- 258 of the 500 S&P stocks closed with Daily RSI(14) at/under 40
- ONLY 22 of the 500 S&P stocks closed with Daily RSI(14) at/under 30
- SPX Weekly SLOW STOCHASTICS @ AUG 2015 CORRECTION LOW Levels
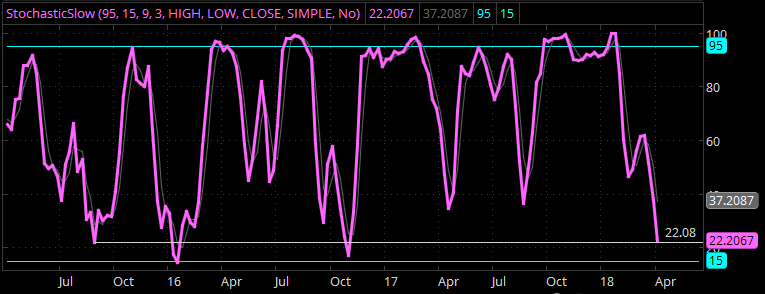
So, SPX literally hit the exact same low on the Weekly SLOW STOCHASTICS yesterday as it did on the AUG 2015 “Lucy Passport” Market Crash (which DOUBLE BOTTOMED end of SEP 2015). Coincidence?
The lower lows below 22.08 you see there are the FEB 2016 LOWS and the DROP INTO THE 2016 ELECTION. The Weekly is a BIG TIME FRAME, but it brings up the argument for NEAR or HERE.
SPX Near or Here In Detail
With how we failed to even attempt to test/break last week Thursday’s 2659 High or even the MAR 2 2647 Lows, the preferred count is now that minute-c of minor-c of intermediate-c of major-4 is underway: aka the market is getting close to wrapping up the final wave down.
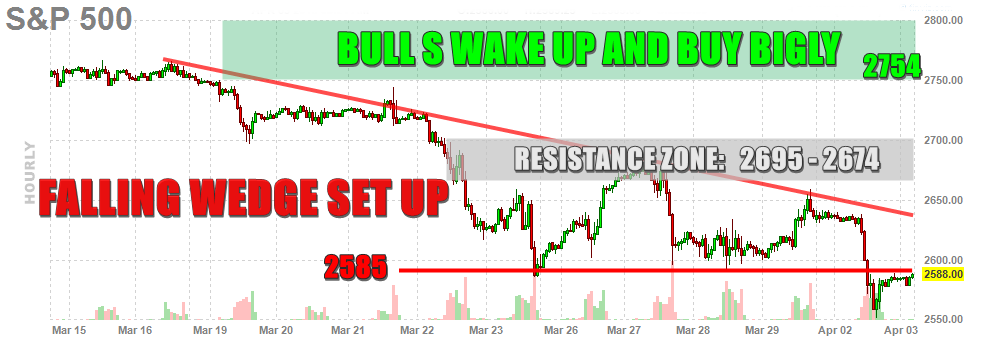
We could possibly subdivide and chop into a micro-a, b and c wave with SPX 2525 at the 1.618 extension, but we’ve been using 2585 (-10% from 2873 ATH) for a base other than theFEB 9 break down to 2533 and the pattern is clearly displaying a FALLING WEDGE PATTERN into this Friday’s JOBS Report.
If we were to break down and lose all sense of technicalities, the 38.2 retracement to the FEB 2016 lows (where this MAJOR WAVE BEGAN) would peg us @ 2467 – just under theAUG 8 ATH @ 2491 and just inside the a=c count to 2450/2475.
3rd Month & 4th Week
Yesterday we started the 3rd Month of the CORRECTION and the 4th week of the drop from 2802 – a timely argument that we’re due to end this rather soon. Calculating the POSSIBLE DOWNSIDE REMAINING, and we’re 3/4 (or 75%) of the way done with this before starting MAJOR-5 for the last and final upward run before this clears way for a PROPER WAVE DOWN (can discuss that in detail over Memorial Day Weekend).
Trend Line Madness
We’ve come to the level where multiple support attempts are being made on significant support trend lines from multiple points over the past 3 years. One which we had to bring up and detail is from 2010 which argues why support can still fall to as low as SPX 2450/2425.
The most significant is obviously the 200d SMA which every algorithm has programmed within it to buy at least a portion at – the “warning zone.” This DOENS’T NEGATE the likelihood of a further downside to 2540 – 2460.
In Summary:
The 2510-2450 target zone remains in play with a small adjustment to 2525-2425. TheIDEAL TARGET is still for a DOUBLE BOTTOM @ 2530 +/- 10.
Even though SPX closed below the 200d SMA, it’s a RISING 200d SMA, not a DECLINING ONE so the Bearish Nonsense in the media is just scary noise.
Although we have that FALLING WEDGE PATTERN from the 2802 High 4 weeks ago yesterday, we have a much larger FALLING WEDGE PATTERN still to be filled when you take the trend line off the HIGHS (2 of them) which we won’t see likely see pinching until the end of next week.
The BULLS AREN’T STUPID and those 258 of the 500 S&P stocks with Daily RSI(14) at/under 40 will be SPX BUY SIGNALS when half of those are at/under 30.
While there are ZERO SIGNS OF A REVERSAL – despite the green entry into the EU Open here @ 4:11AM EST, I’d look for a REJECTION around SPX 2605 with 2622 the upper resistance target before selling commences again and we revisit yesterday’s playground with that 2566 & 2555 magnets down there – theoretically before Friday’s JOBS Report.
For those WANTING CALLS ON ANY STOCKS/ETFs, look towards JUN 2018 or JAN 2019 and use the ATH as the furthest strike price with earnings due to commence in a week (tech starts end of April) and Major-5 still due to come (unsure if we break SPX 2873 for now). Obviously JUN is closer than JAN so conservatively I would use the 1-month high for JUN CALLS and the ATH for JAN 2019 CALLS (except TSLA).
In Elliot Wave Terms, Major-4 (which we’re in now) will be followed by the final Major-5 which likely takes out the ATH by a portion. As I was chatting with Kelley about last night, we have a CELESTIAL SOLAR STORM to trade off of starting JUNE 1 into AUG 18 so I really hope we can bust a move like Young MC in this Q1 ER and have a BREXIT like V-Shaped recovery to be able to short the hell out of SPX back down to the 2300s when Major-5 ends.


